A comprehensive data insight that is for everyone.
Our AI-powered dashboard lets you instantly create tailored templates, saving you time and effort on manual setup.
Creator Software Platform
UI/UX Design
Desktop Web
2024 Mar

07
Sound familiar to you?
Feeling a bit lost in the data jungle?
Spending weeks sifting through data, trying to piece together a dashboard that tells the right story?
Ever feel like you're stuck in a never-ending data maze just to get your dashboard up and running?
Each Persona Wants A Different Story. A Different Dashboard.
CEO
SALES MANAGER
Revenue
Sales Revenue
Profit Margin
Sales Targets
Average Order Value (AOV)
Average Order Value (AOV)
Customer Lifetime Value (CLV)
Customer Acquisition
Inventory Turnover Rate
Inventory Turnover Rate
Return on Investment (ROI)
Sales Performance by Product
Customer Acquisition Cost (CAC)
Sales Pipeline
This is how we used to create dashboards.
01
03
05
06
Dashboards ready.
Decide what KPIs we need.
Choose widgets from a builder tool.
Drag and drop widgets for each KPI metric.
Tailor each measurement for each specific industry/persona.
Continue to refine data and visualization.
With VISUALIZED.IO, You Can.
01
03
05
06
Dashboards ready.
Tell AI what industry you are in and your goals.
< Automated >
Dashboard AI
Quick & Easy
Our Solution
Builder Tool
Advanced
Dashboard
creation
process
Full Development
High-cost
Operator
Anyone
No Skills Required. Gaining insight into your business is fast and easy.
Expertise Required
Skills needed to leverage the full capabilities of the tool to create high-quality dashboards.
Stakeholder & Developer
The developer builds the dashboard from scratch according to stakeholders’ requirements.
Generate
Dashboard Metrics
Instant Result
You can generate metrics through a simplified input request.
Manual Setup
The operator has to connect data sources, define metrics and KPIs for different personas.
Developer-Focused
Developers write code to retrieve, process, and visualize data according to specific requirements.
Data Visualization
Data Integration
Instant Result
Any
Manual Design
Manual Design
Pre Built Data Sources
The operator must design the chart types and dashboards layout by themselves.
Based on the requirements and data analysis, developers design the visualizations for the dashboard.
Users can only gain insights from some popular platforms as their data sources.
You can generate dashboards through a simplified input request.
We help you connect any data sources based on requirements.
Any
Developers connect any data sources based on requirements.

Empower Every
Sector
Generate Templates
Features
Quick, Painless, & Customizable
Our AI-powered dashboard lets you instantly create tailored templates, saving you time and effort on manual setup.
Consistent and Precise Output
With AI algorithms, your templates will be error-free and consistent across all metrics, eliminating the pain of human error and ensuring accurate data representation.
Flexible Template Adaptation
Dashboard AI templates are flexible and easily modifiable, allowing you to swiftly adjust to accommodate your changing business requirements without extensive manual intervention.

Import your Data
Features
Seamless Data Integration
Easily connect external data sources like Google Analytics to your dashboard, with paid assistance available for integrating internal or external systems.
Streamline Data Analysis
Dashboard AI automatically processes and analyzes your data, saving you time and effort in manual data processing.
Enhance Collaboration
By centralizing your data on Dashboard AI, all stakeholders have access to the same up-to-date information.

Premium Services
Features
Unlock Insights With Any Data Sources
We also help integrate data sources on demand, whether it's your CRM, ERP, or any other databases. Break down data silos and access unified insights for smarter decision-making and business success.
Priority Support and Assistance
Enjoy priority support from our dedicated team of experts in resolving your queries promptly and providing personalized assistance.
Flexible Pricing Options
Choose between a monthly SaaS fee with an initial premium setup cost or opt for self-setup, giving you the flexibility to tailor your pricing model to your needs.
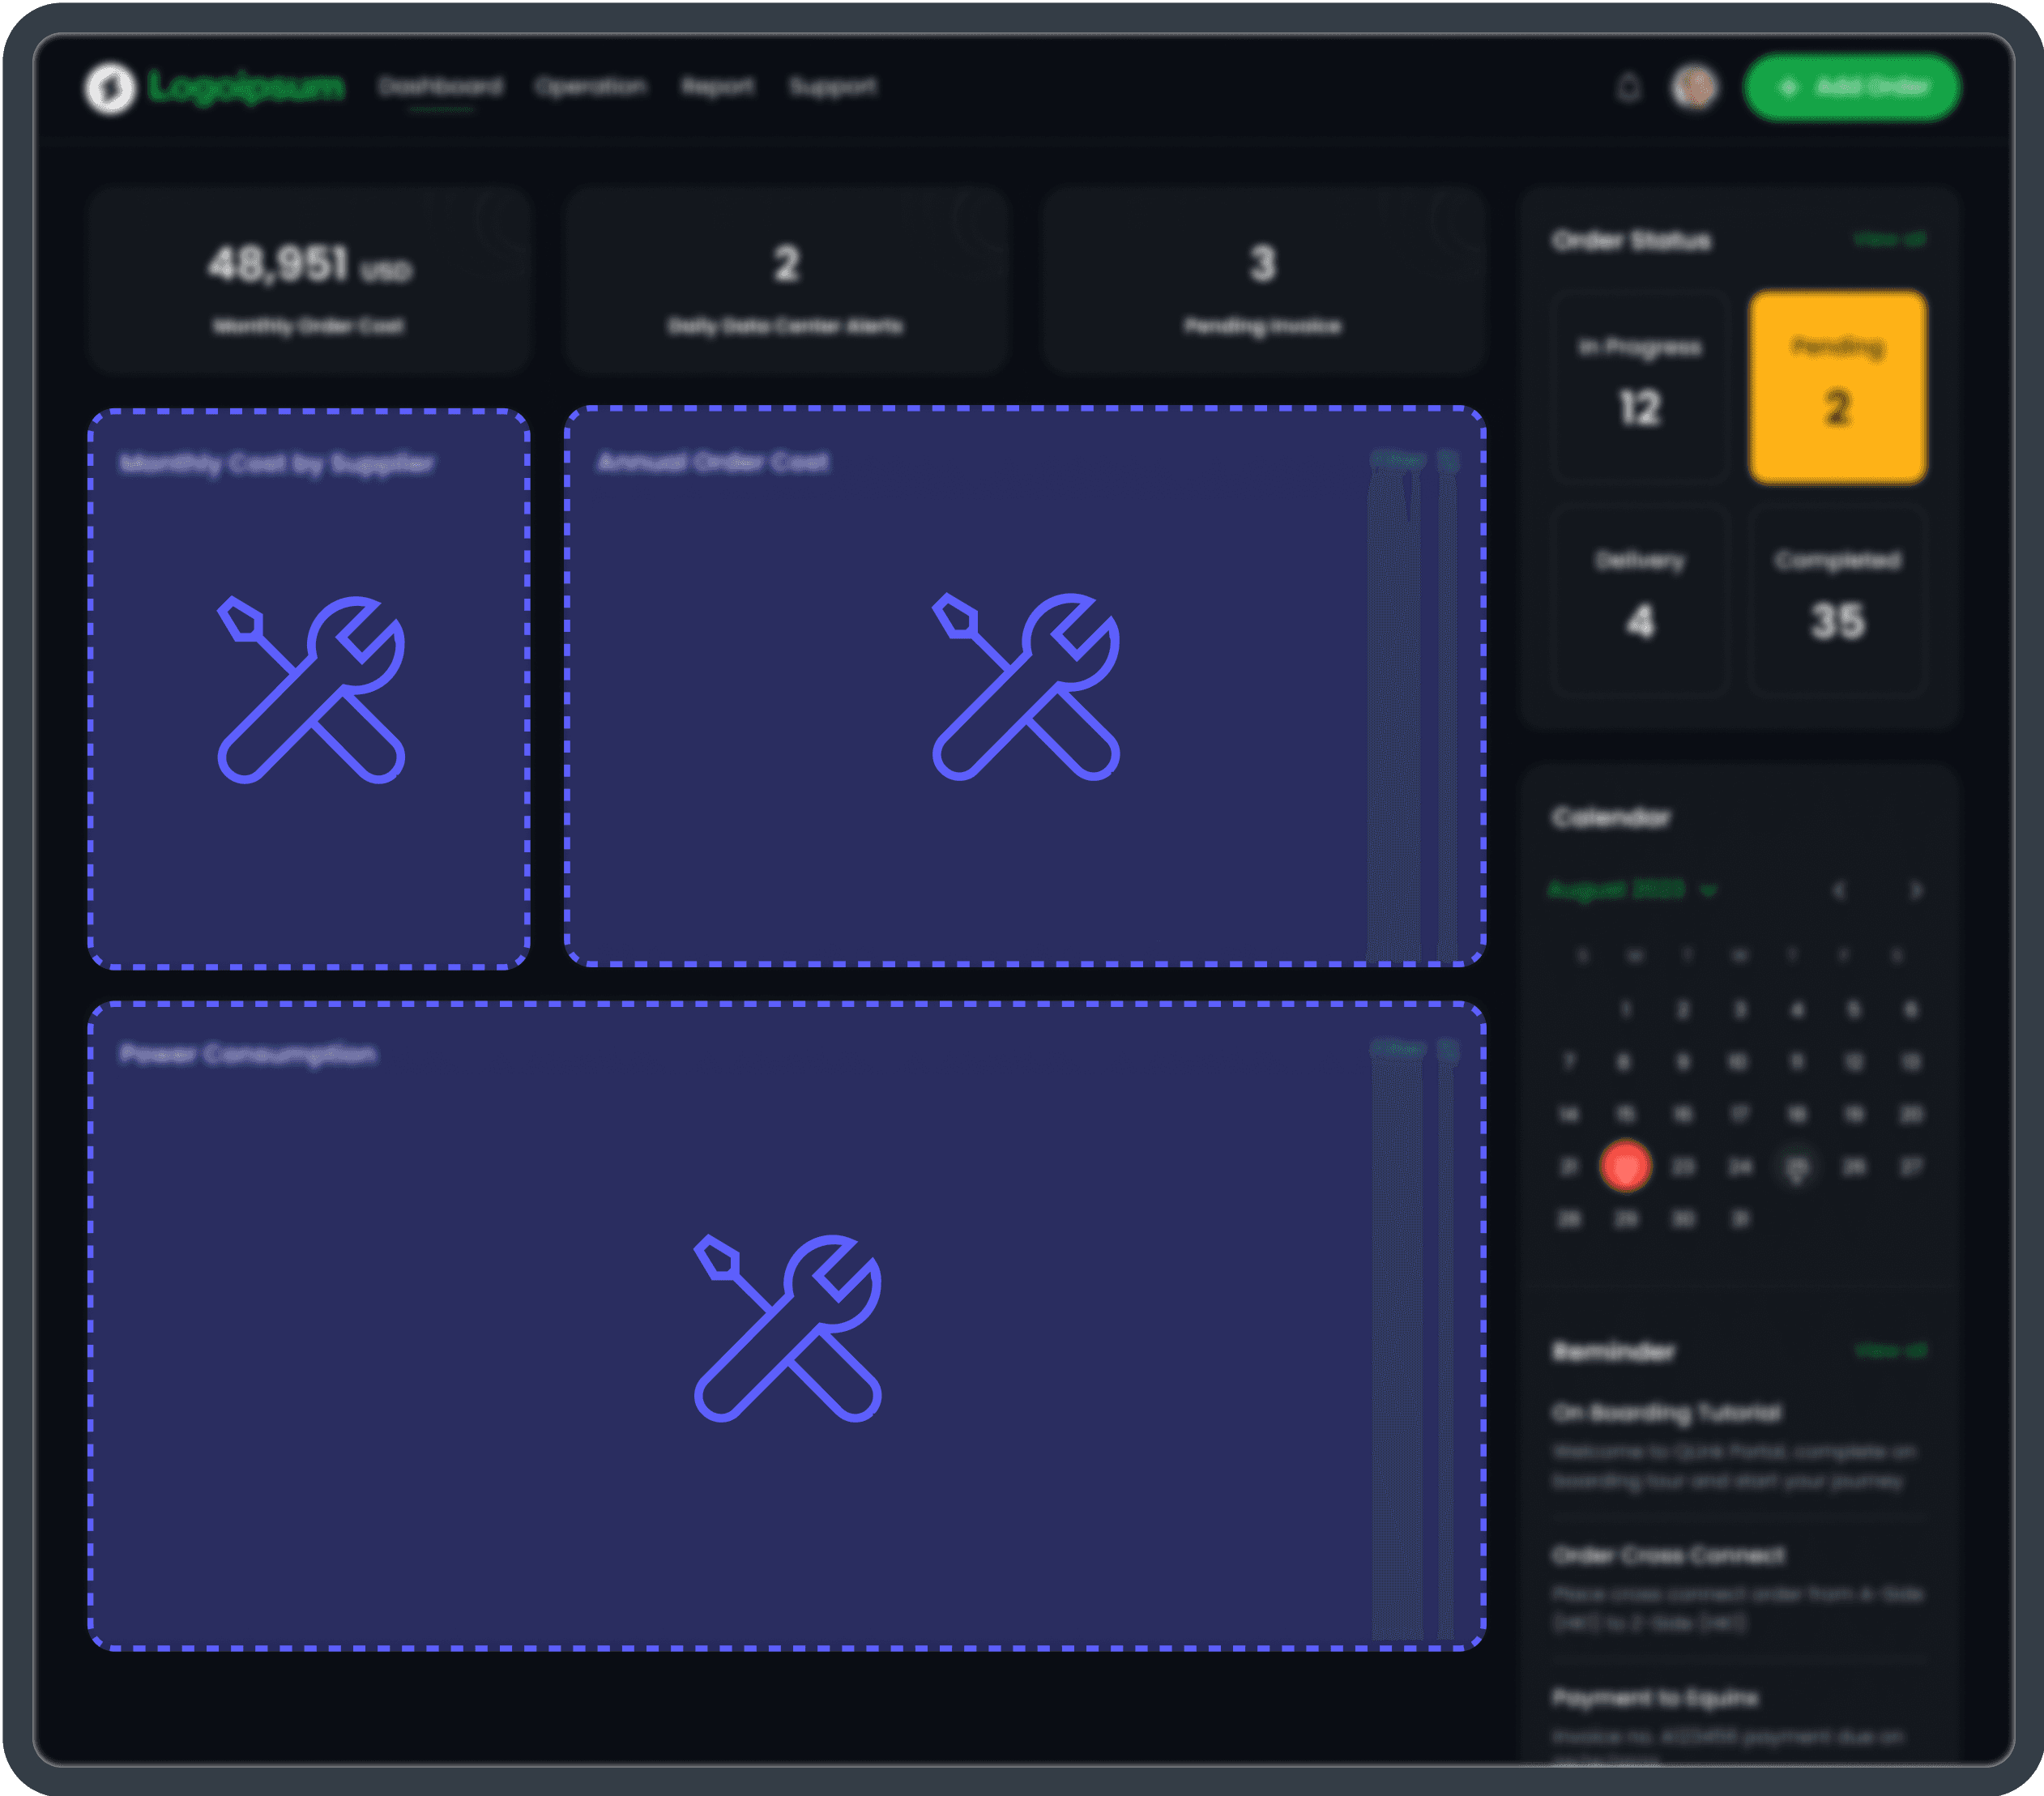
Playground
"Would you like to hear about creating a dashboard with AI prompts first?"
"Or, how about using a pre-made template?"

Pages
Chat Room
AI can cater to all your customization needs. Simply tell AI what you want: the type of dashboard, the target user, the interface style, and the data to concatenate. AI will then provide a dashboard tailored to your specifications.
Macbook Pro
Pages

Create your own Dashboard by AI

Build your dashboard with AI
Create a Financial Report dashboard.
Make data-driven decisions, facilitate strategic planning.
Provide organizations with holistic insights and control their SaaS applications.
Create a Marketing operational KPI dashboard for tracking key metrics, evaluating.
Ask Dashboard AI....
|
Send
Work Area
The work area is where you create your dashboard. Even if you start with a template generated by AI instructions, you can still customize the details and data concatenation for each widget.
Macbook Pro
Pages


Upload Data Files
Adjust Details
Our platform supports various data types for concatenation. The available data types are listed in the work area on the right.
After successfully concatenating the data, you can adjust data details like intervals for the X-axis and Y-axis in the work area on the right side.
Not selected widget
"The background color can be selected in the right work area if no widget is selected."
Select Widget
When you select a widget, you can customize its style in the right work area and upload file data for concatenation.


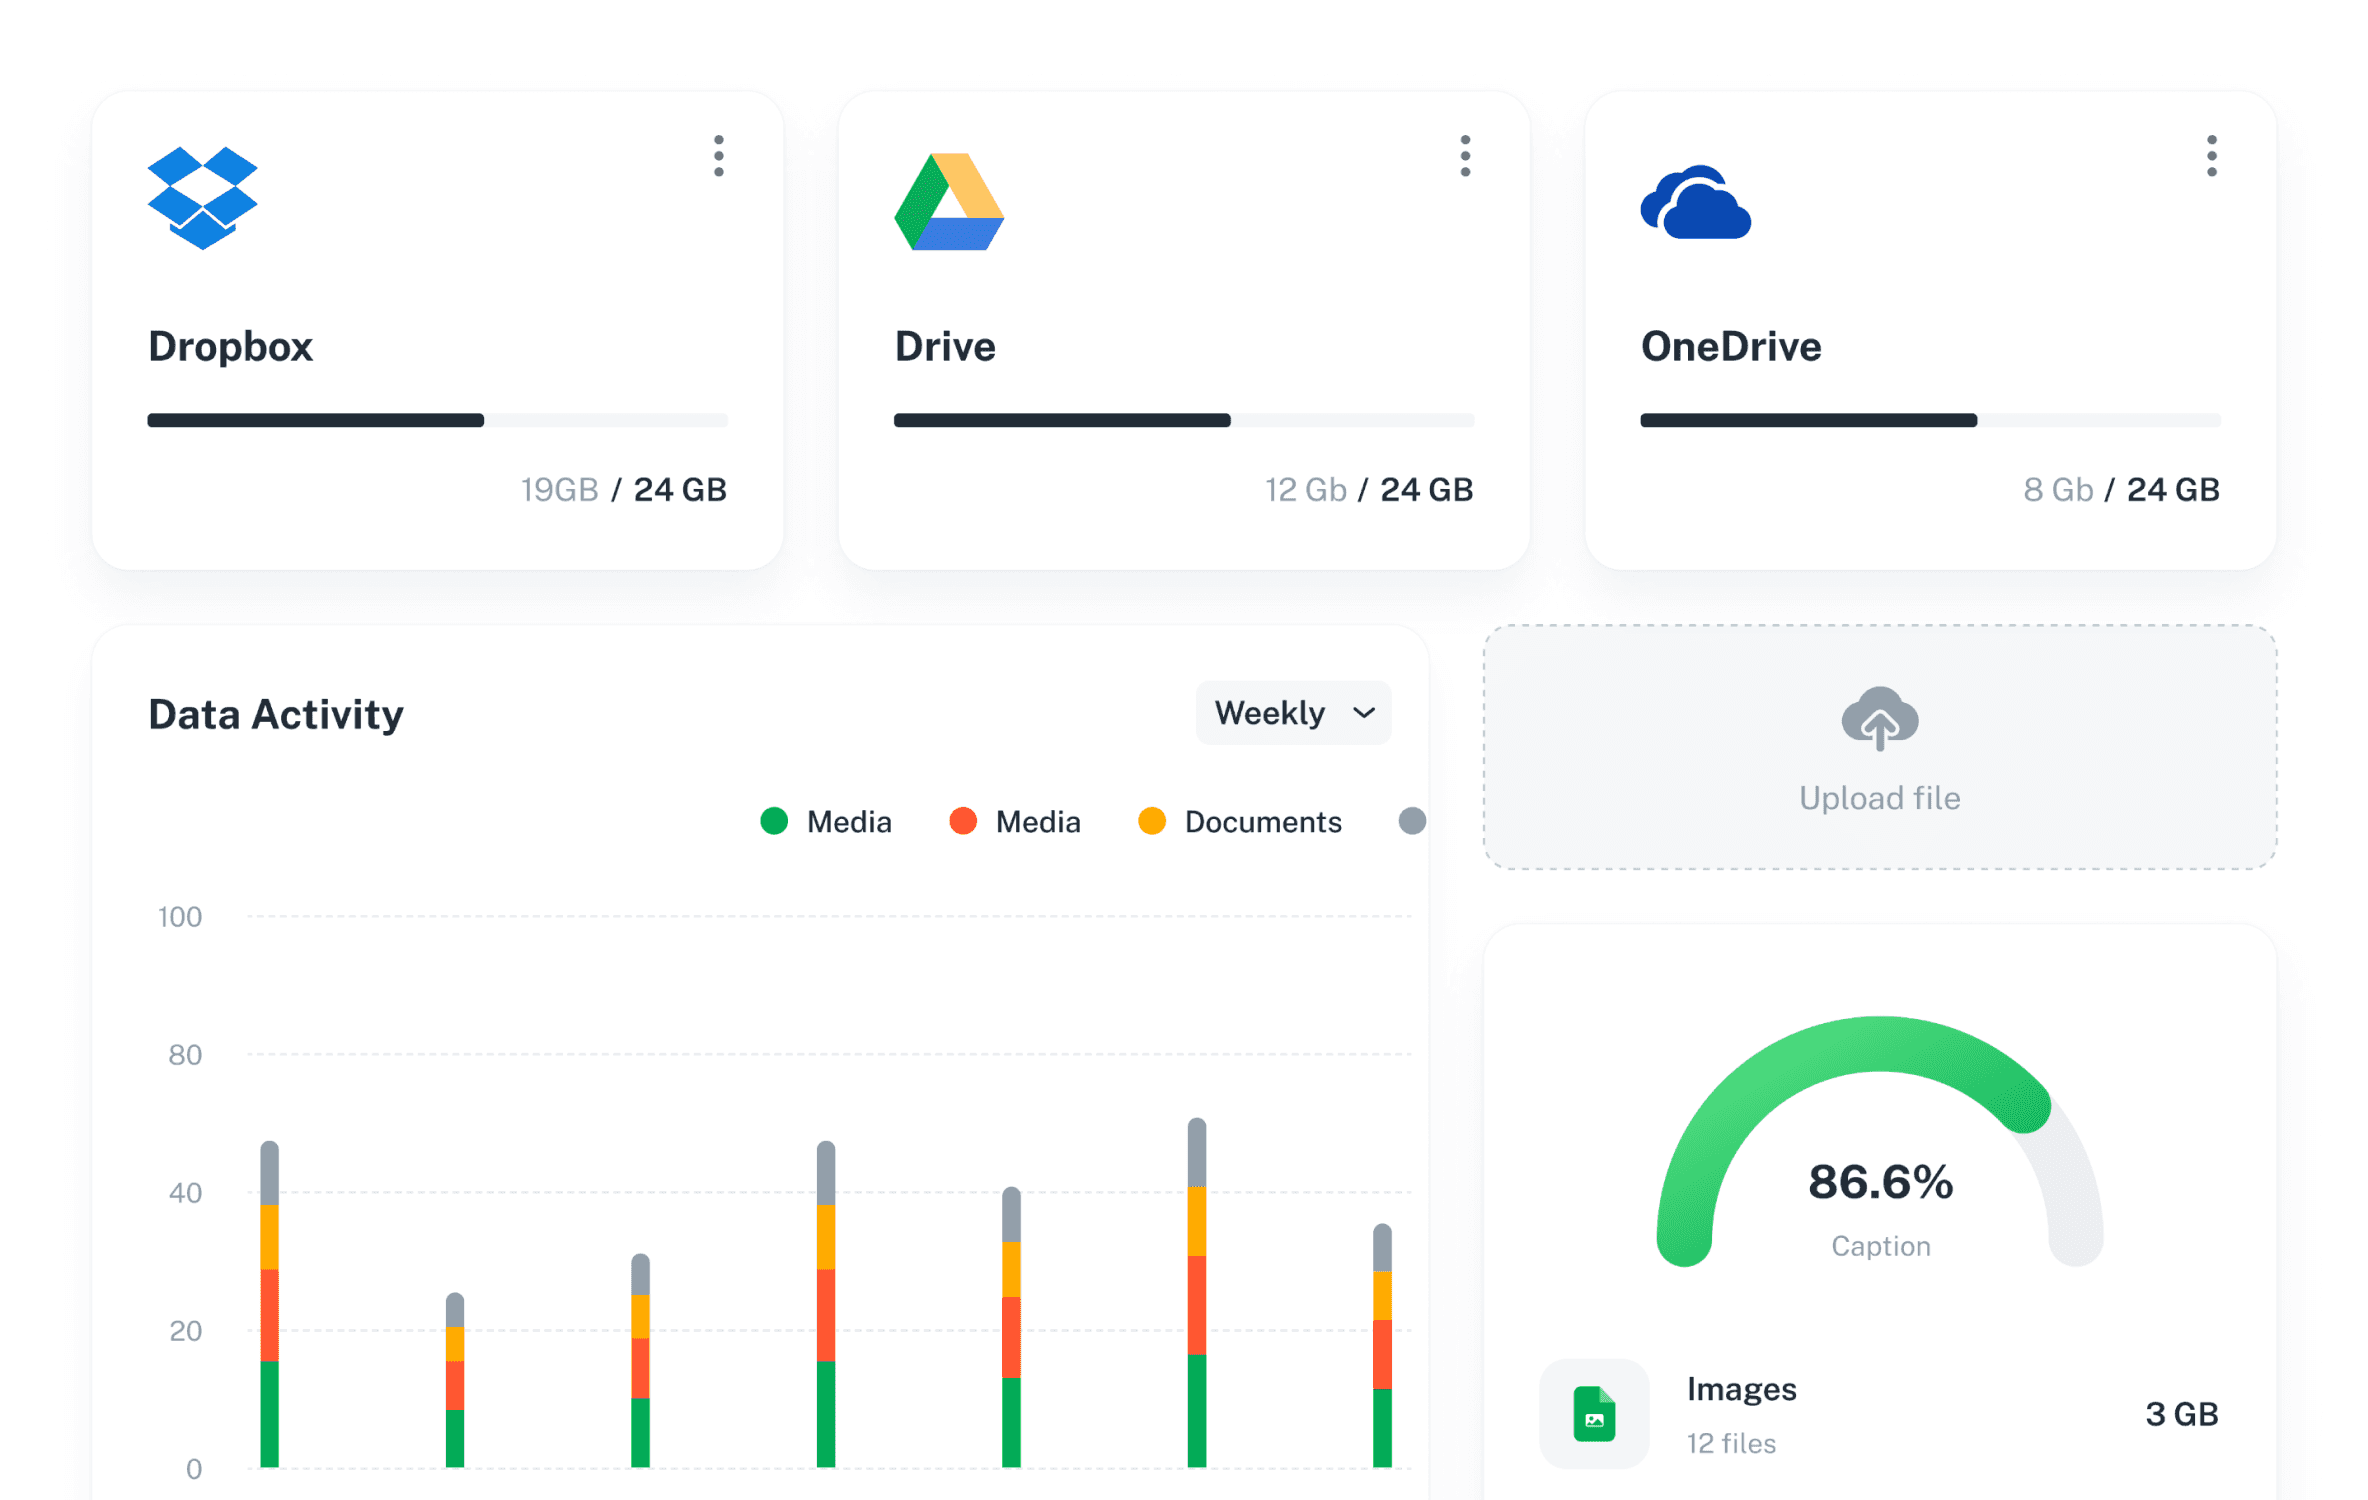


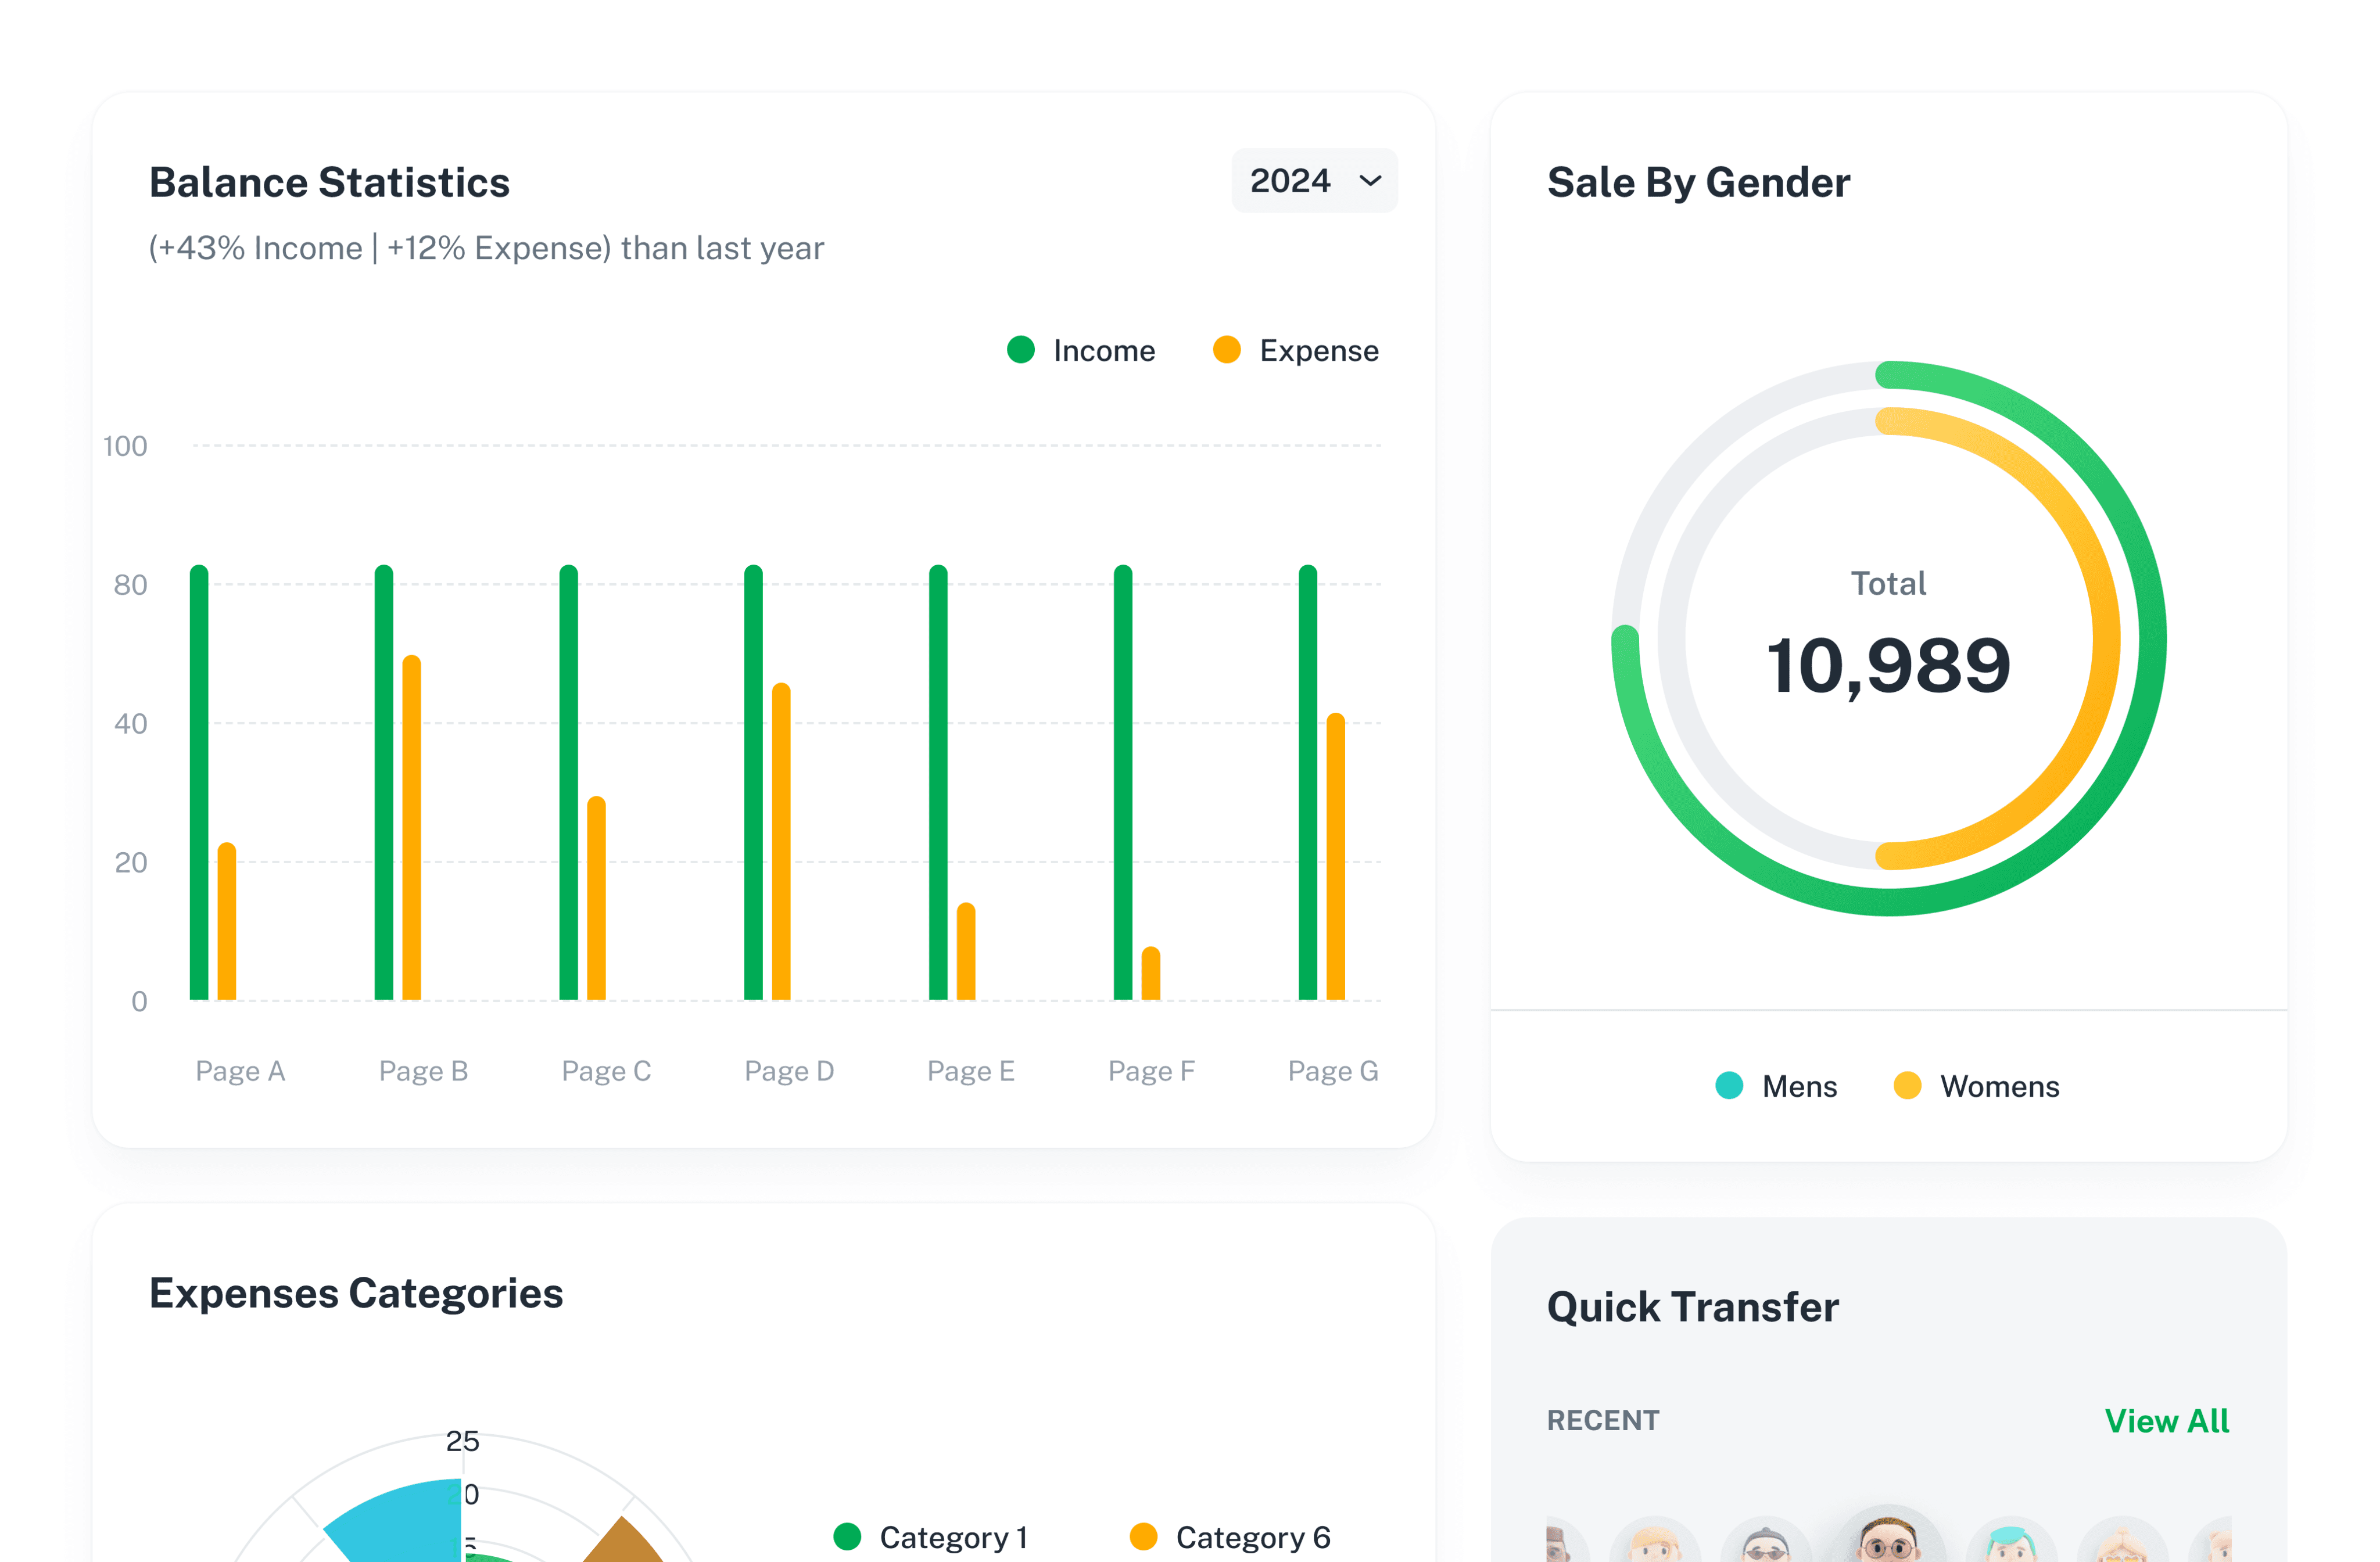
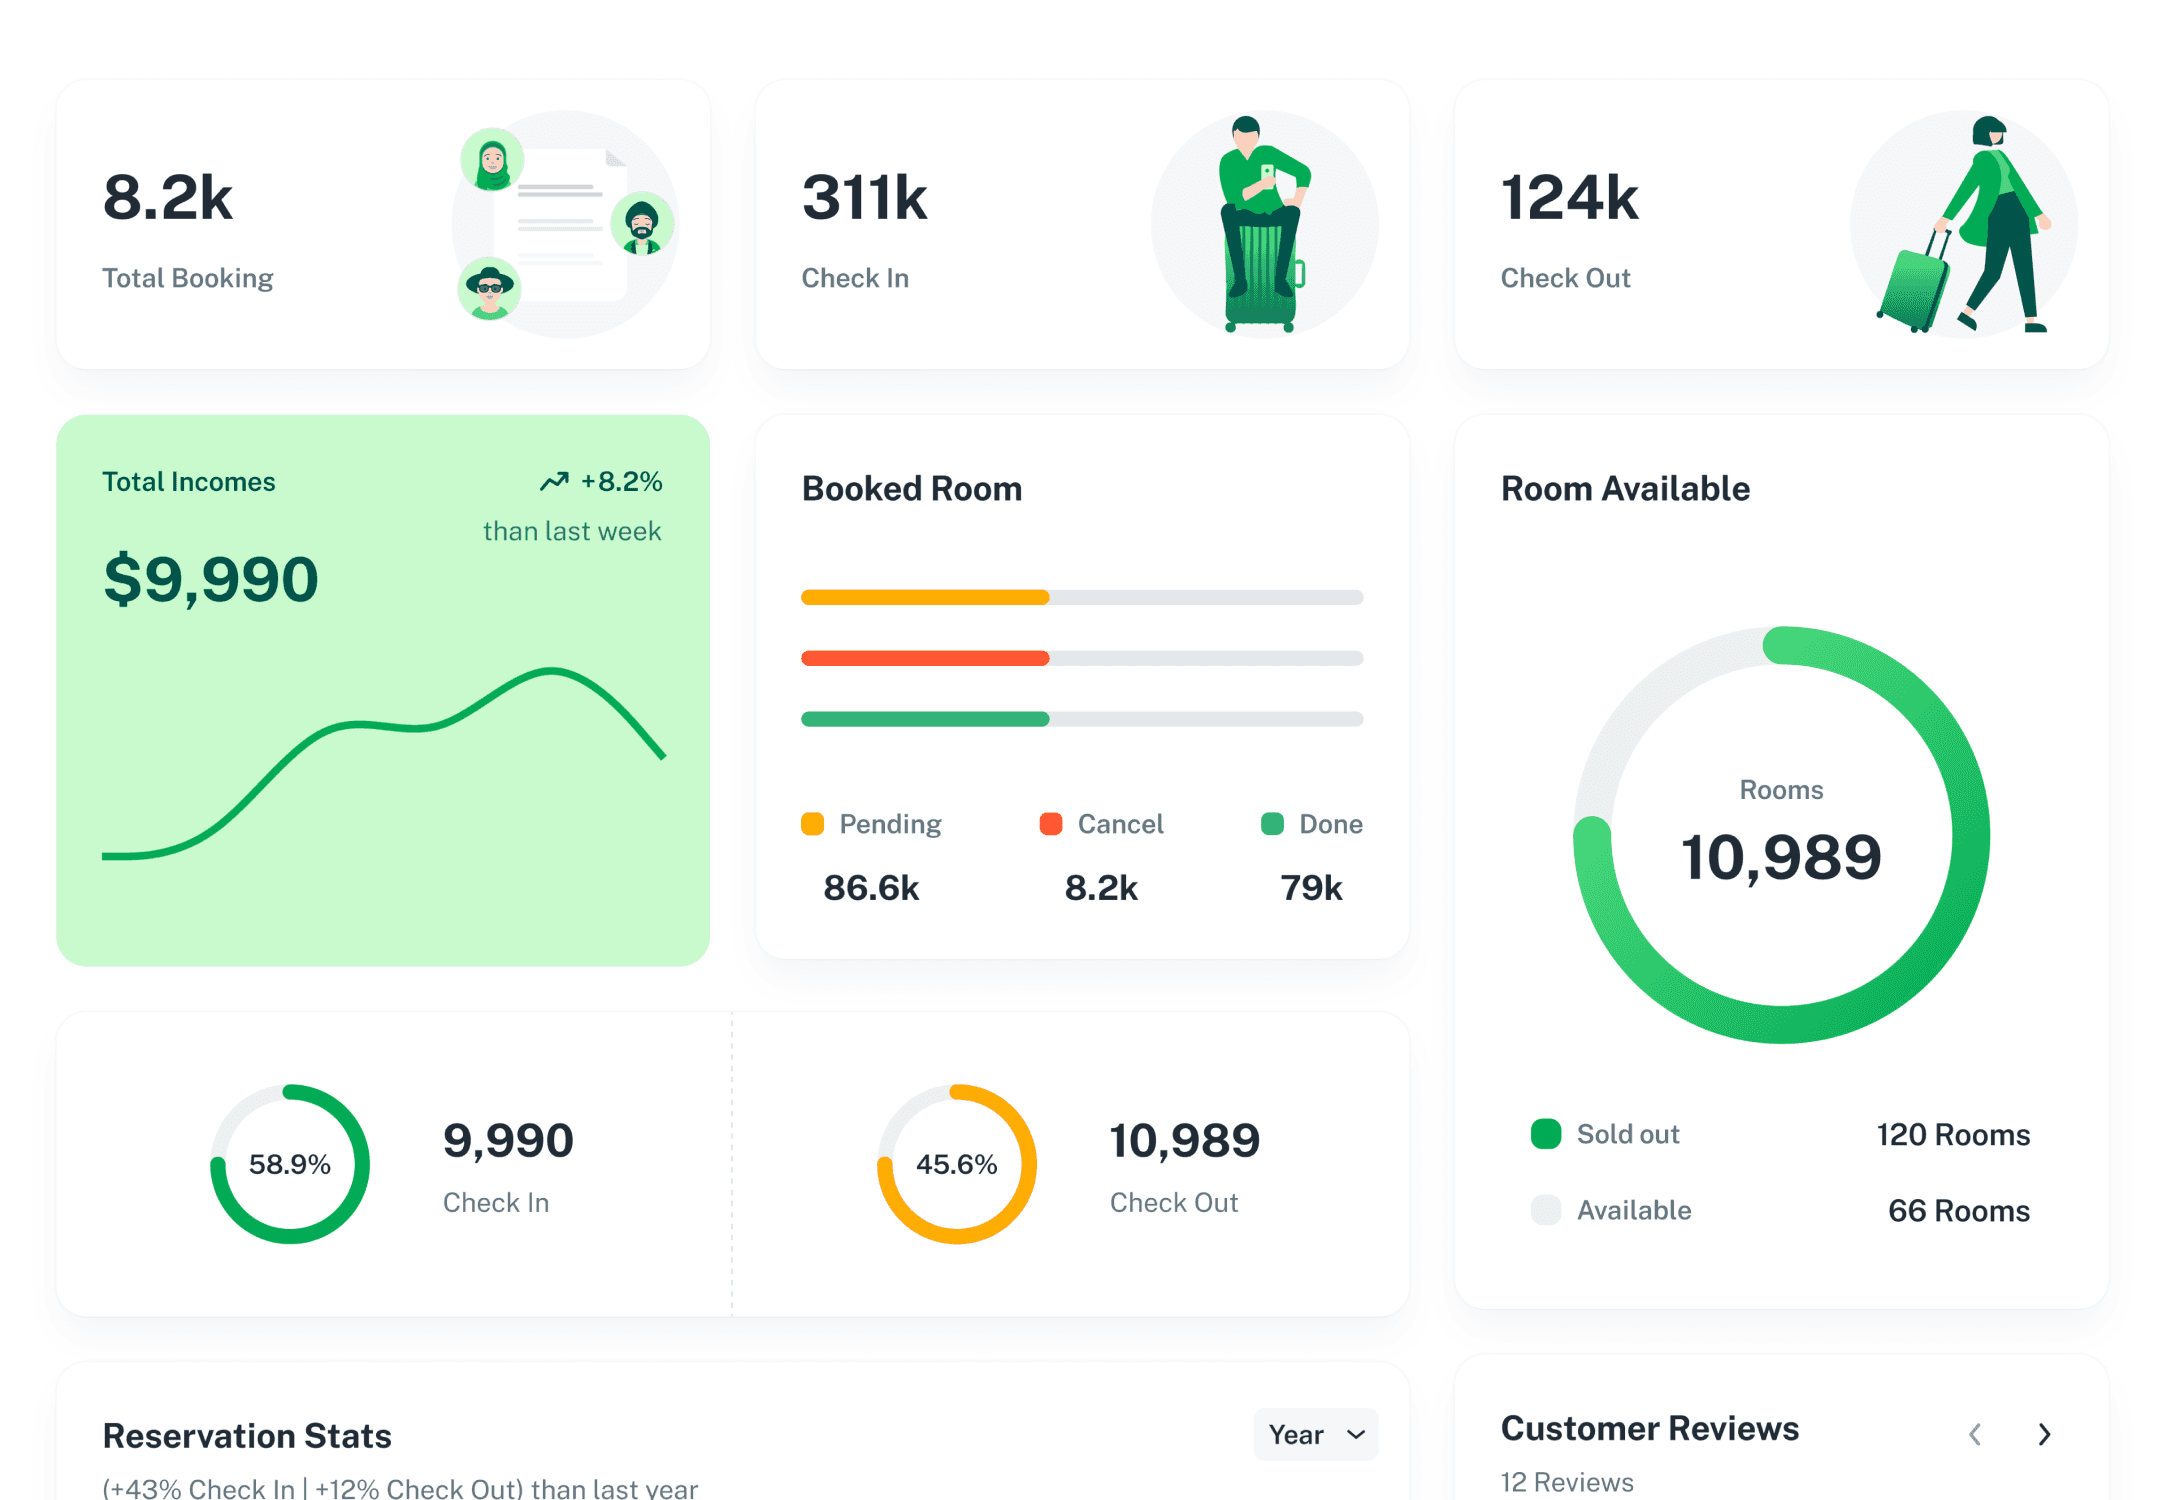



Thanks For Watching