Operation
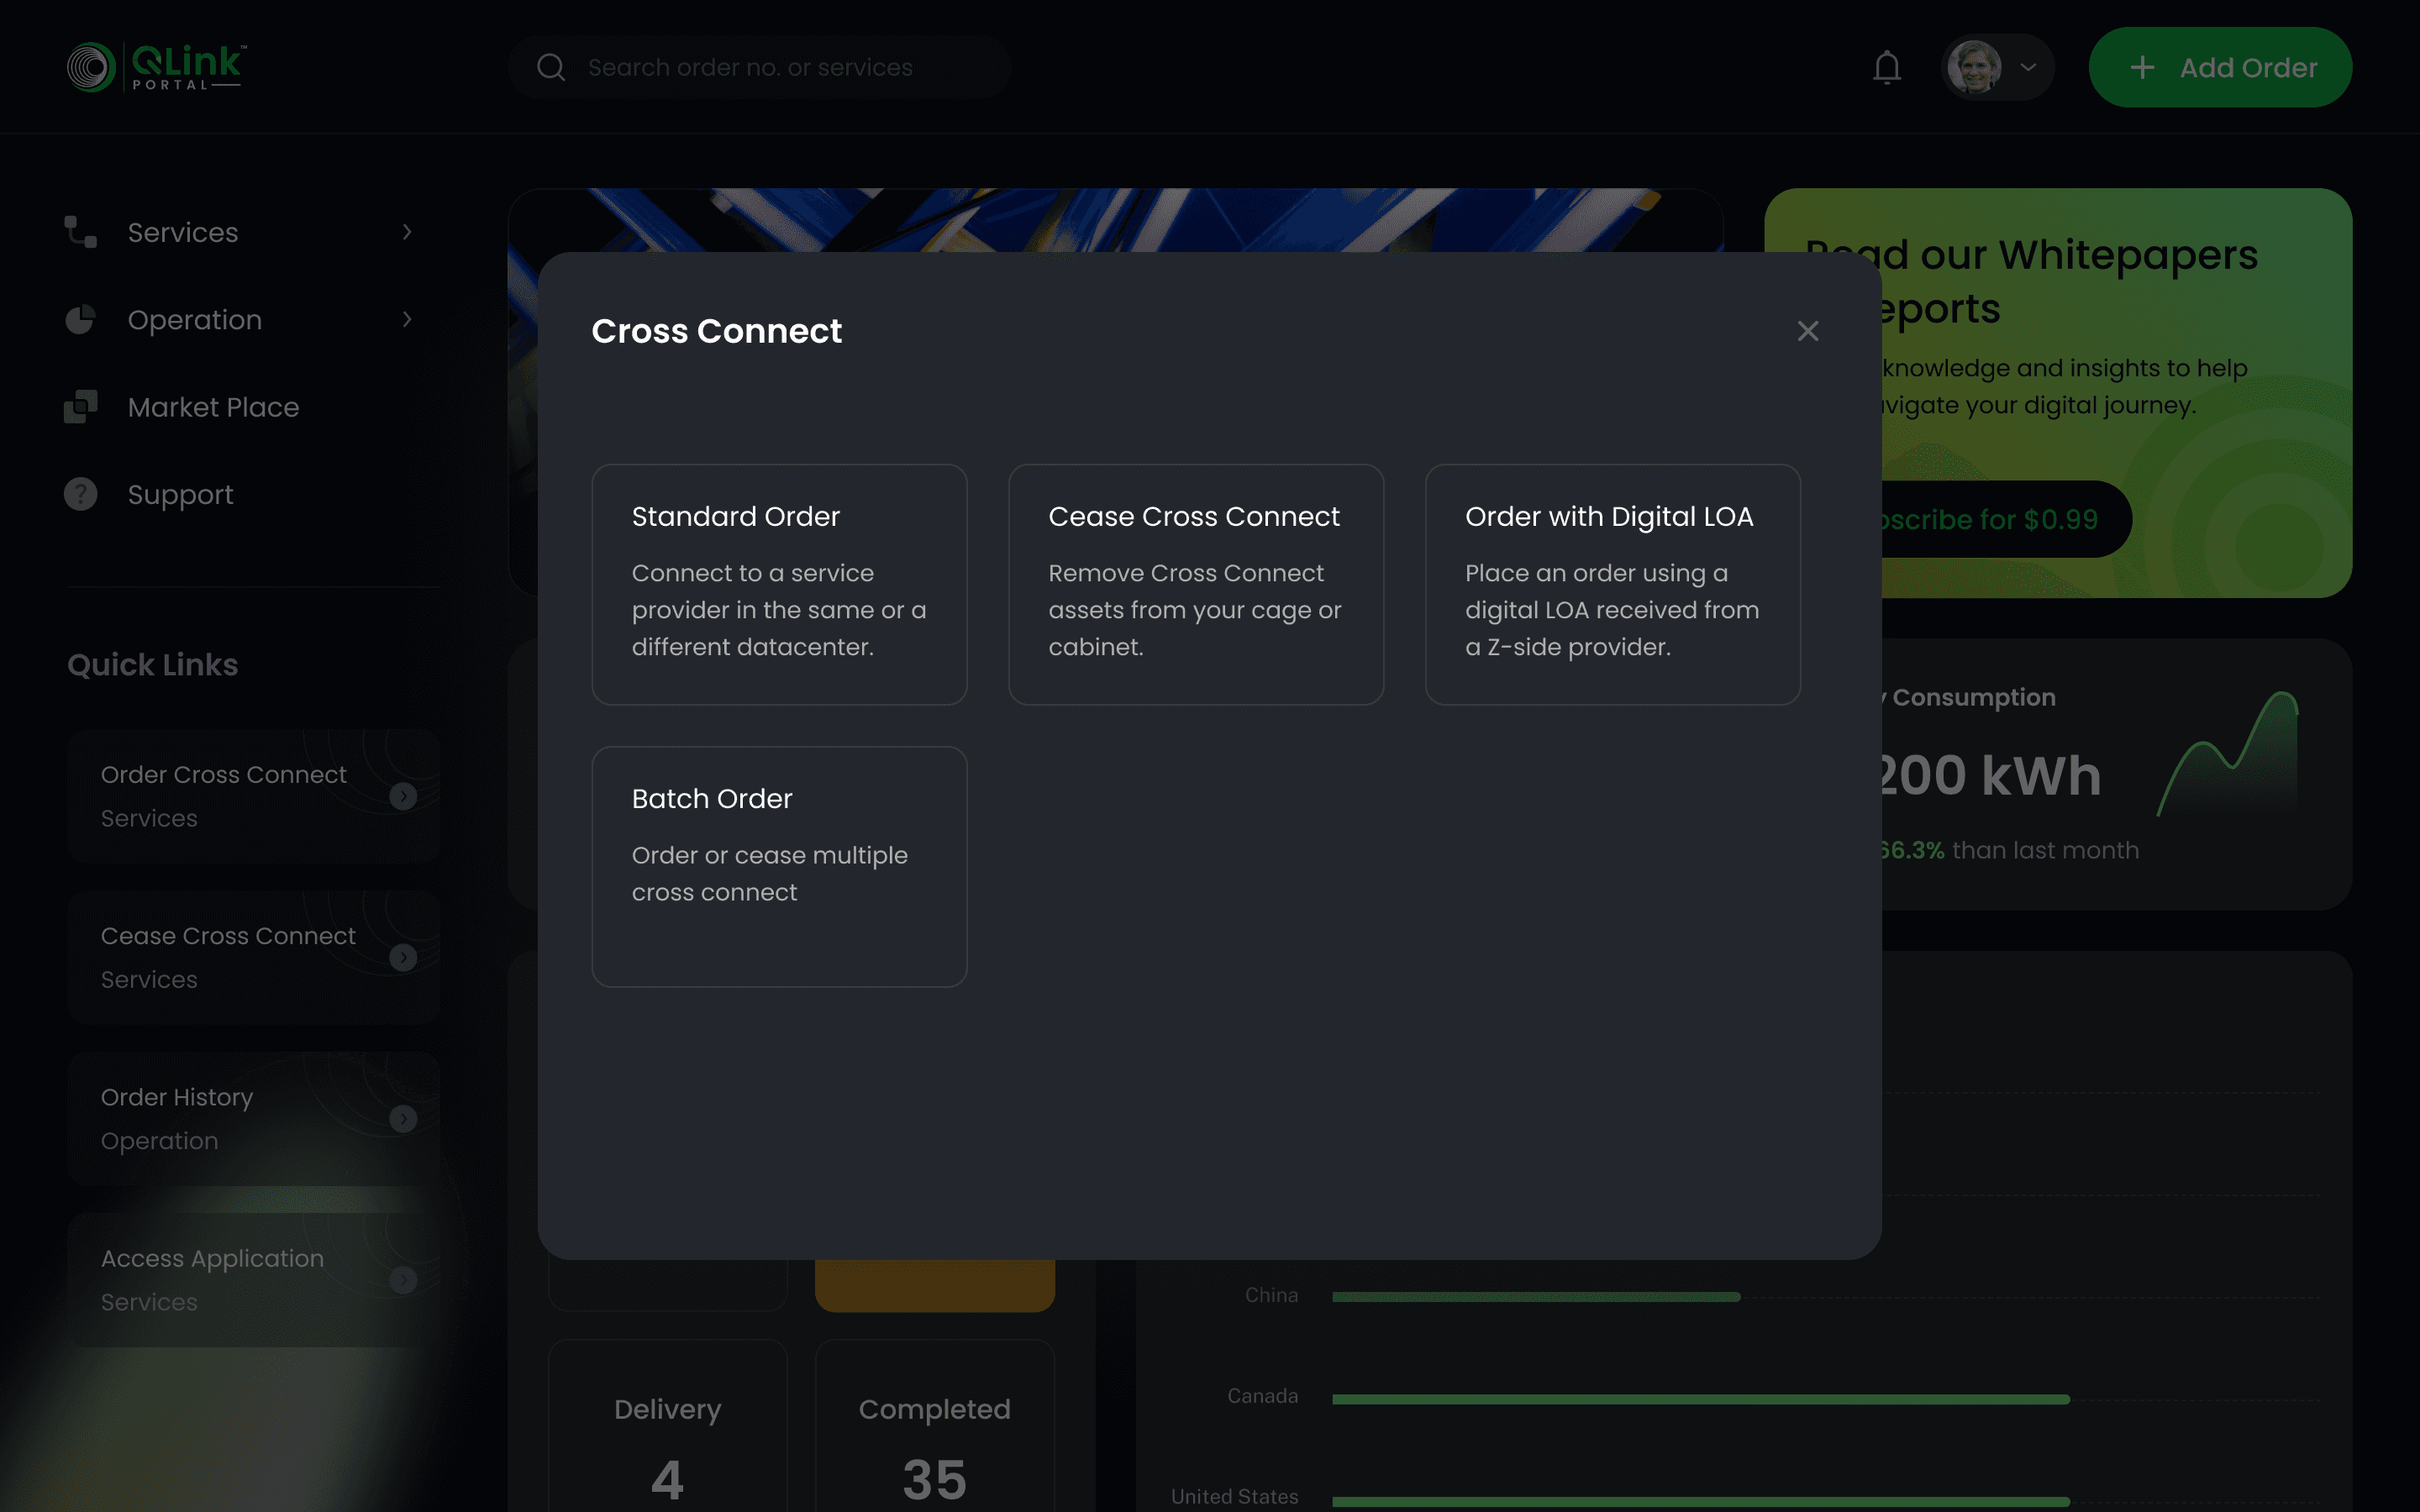
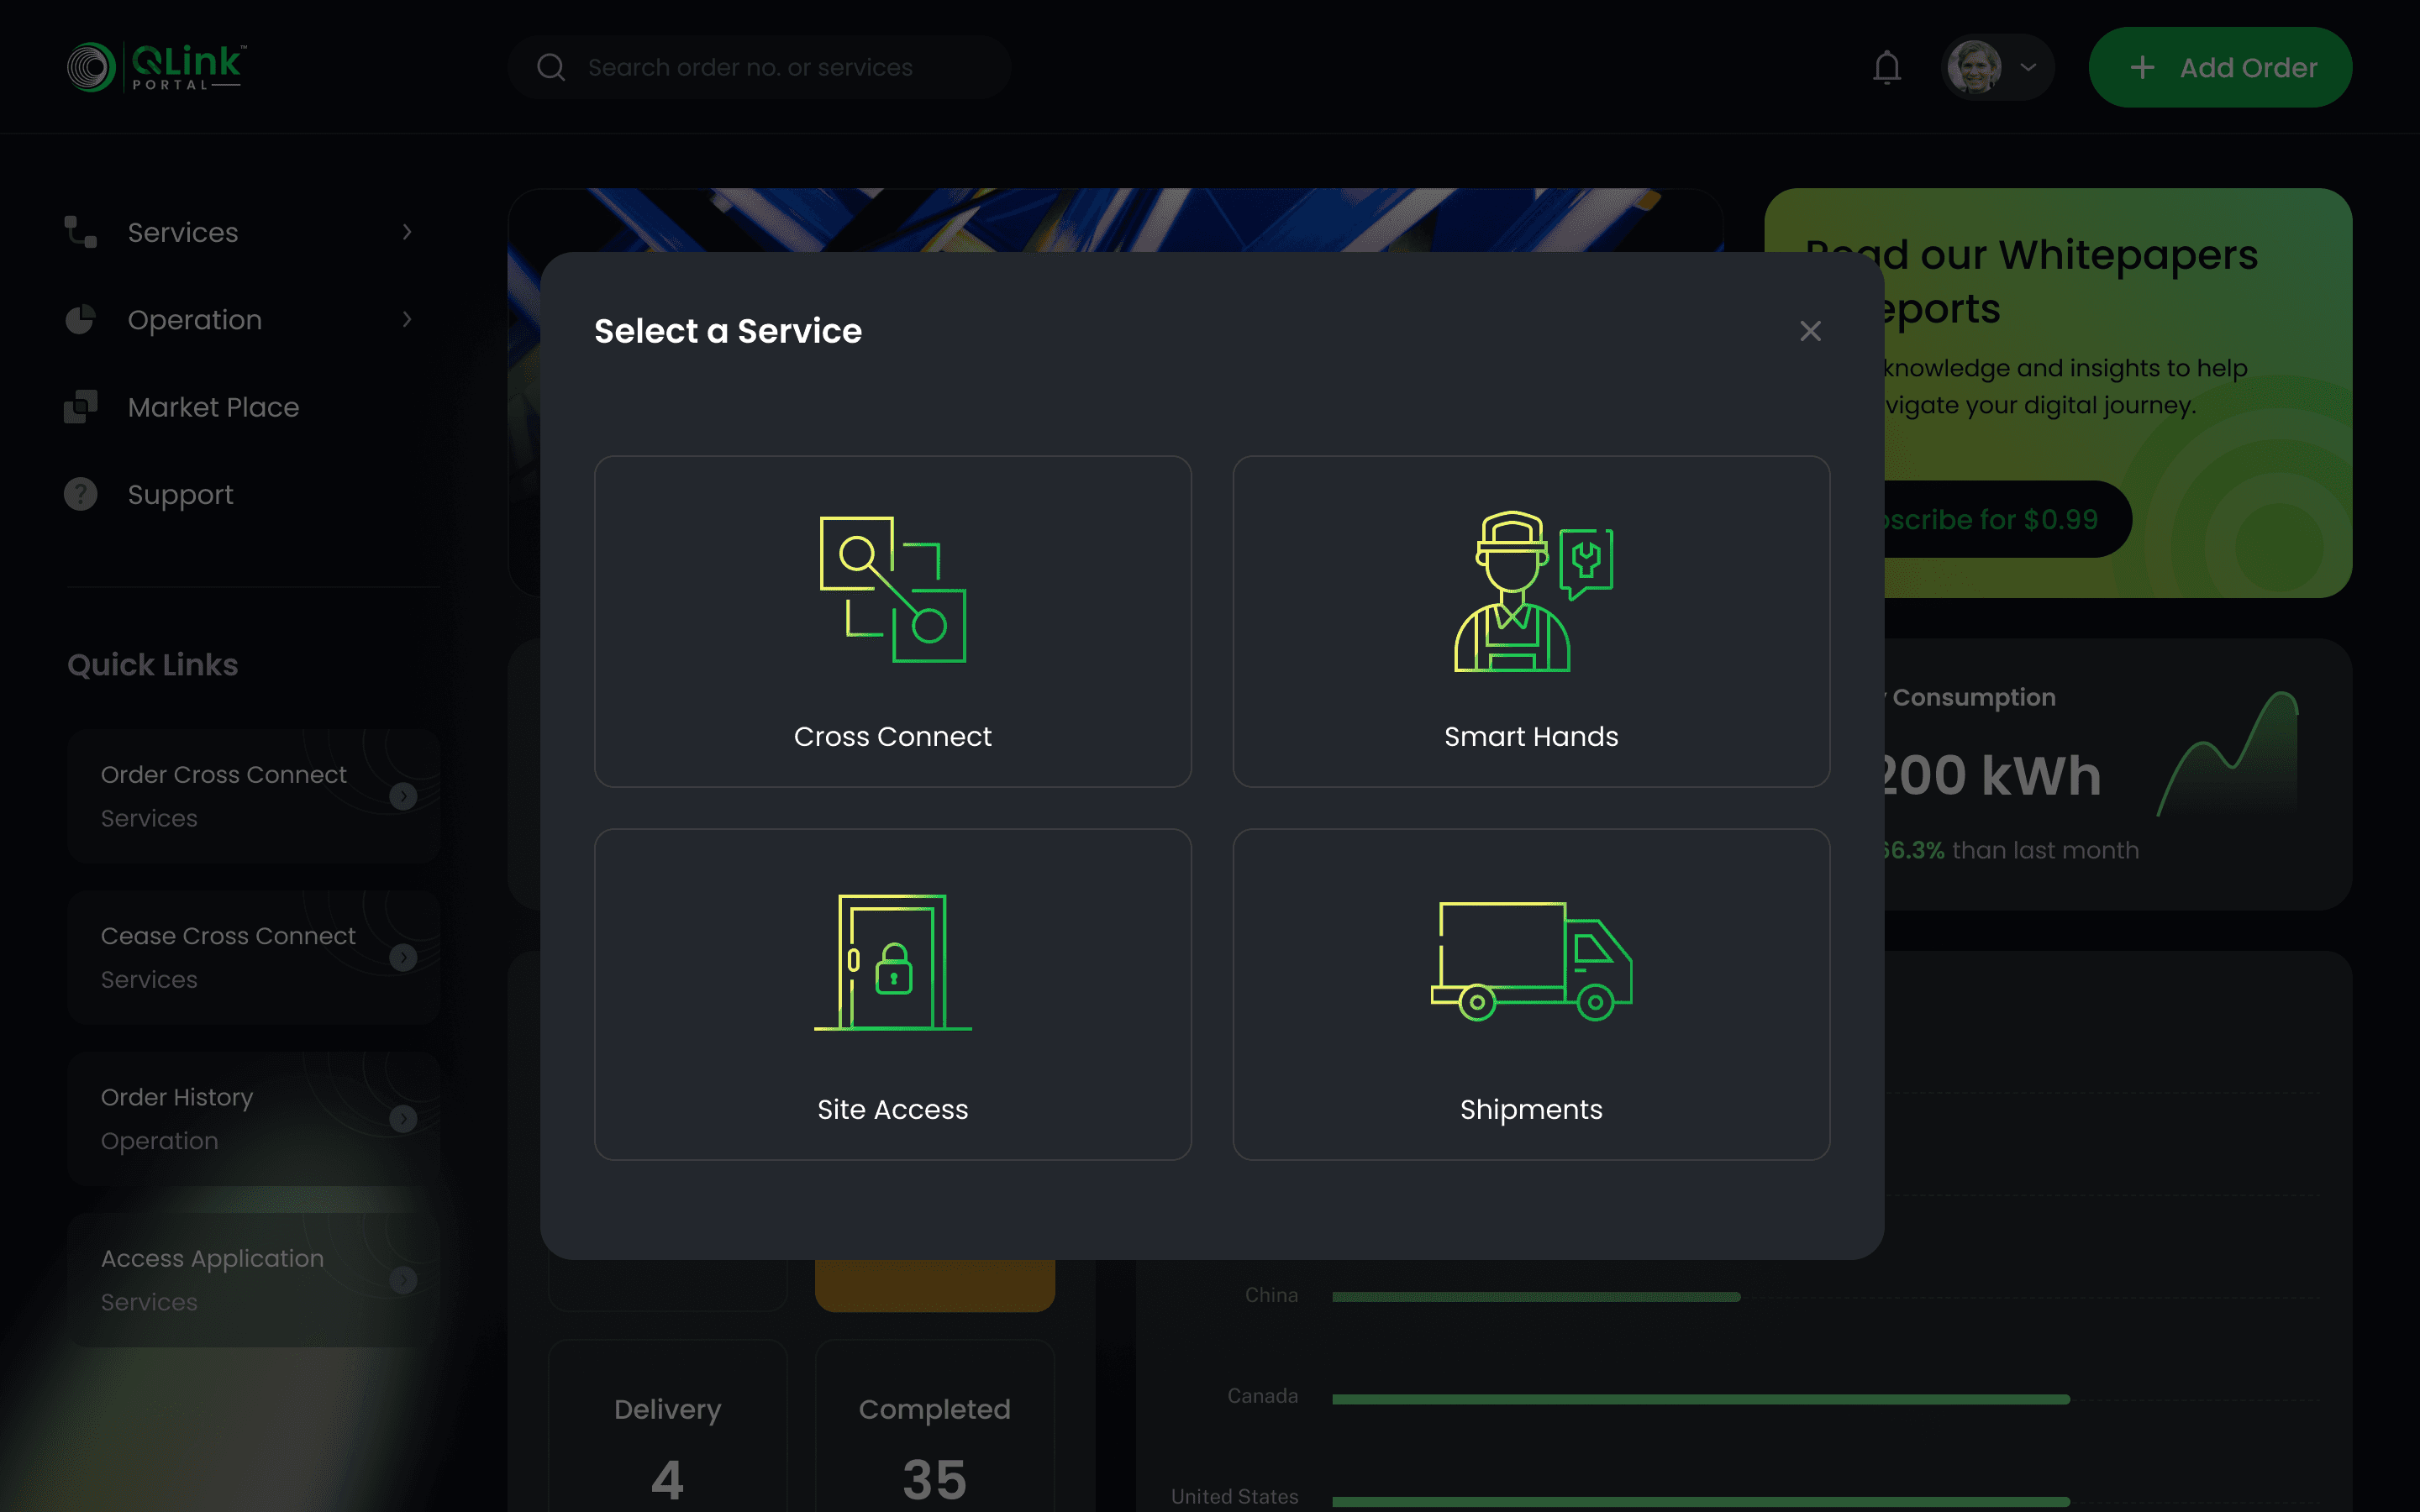
Create Order
Manage & Track Order
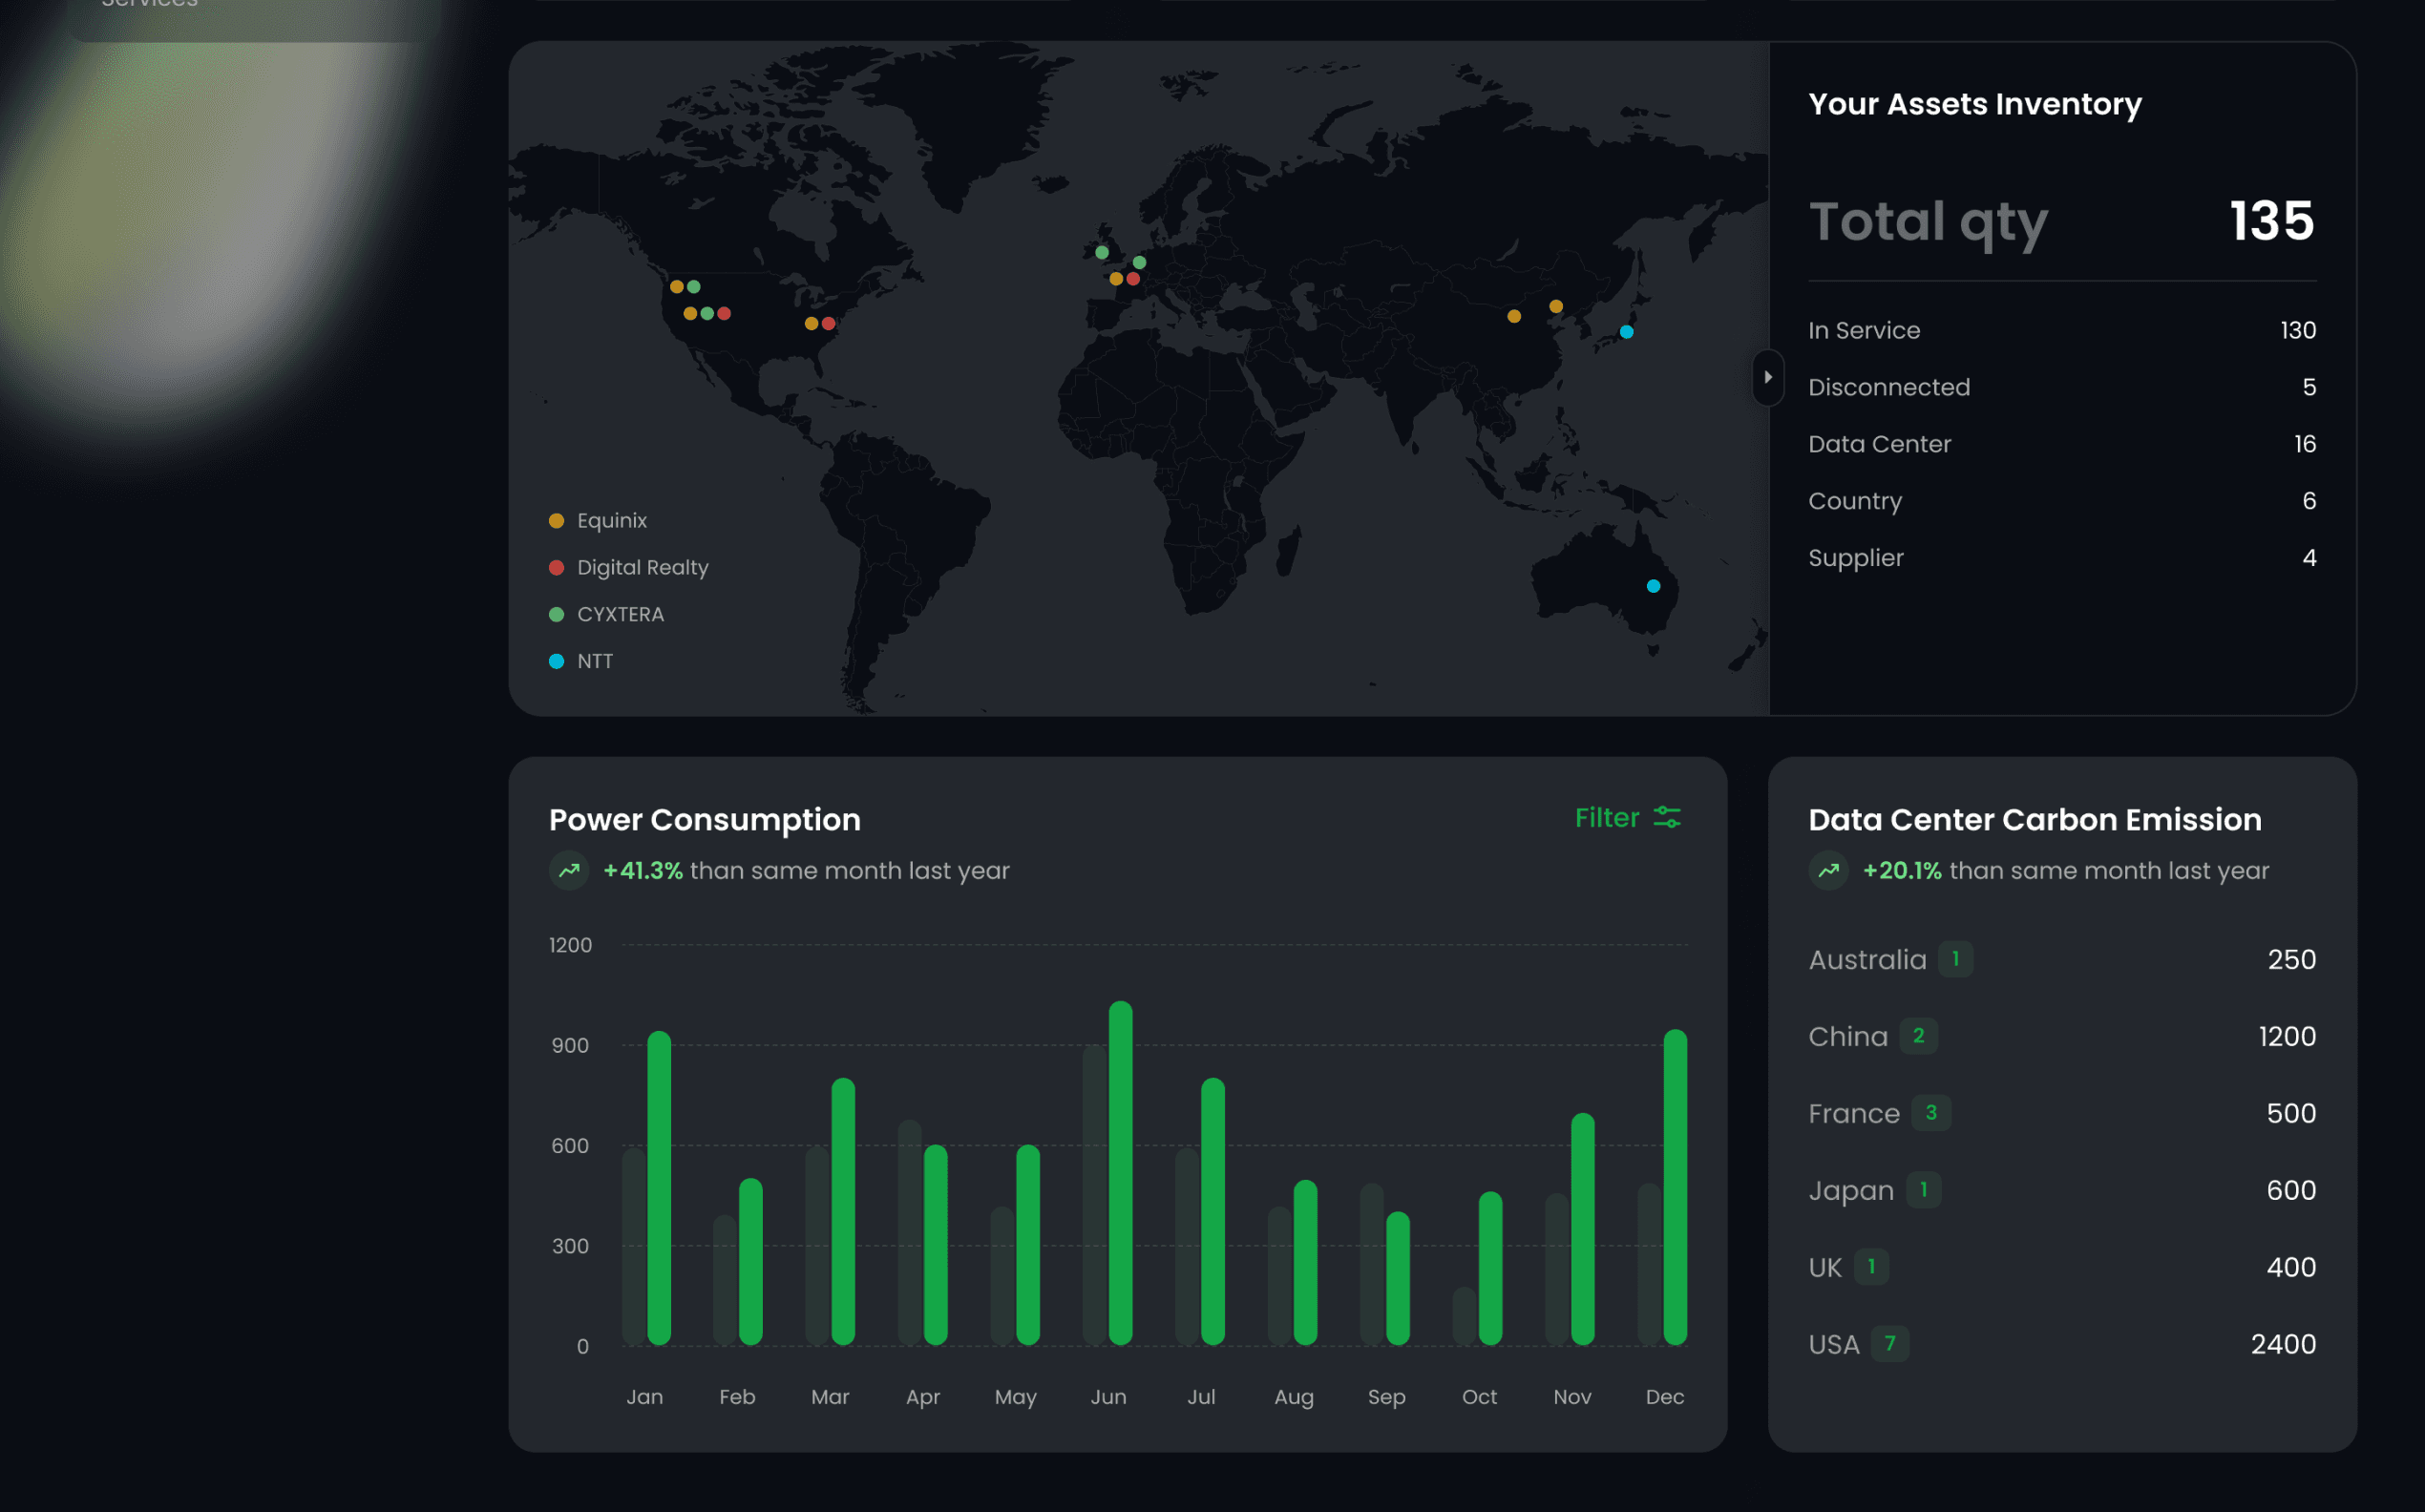
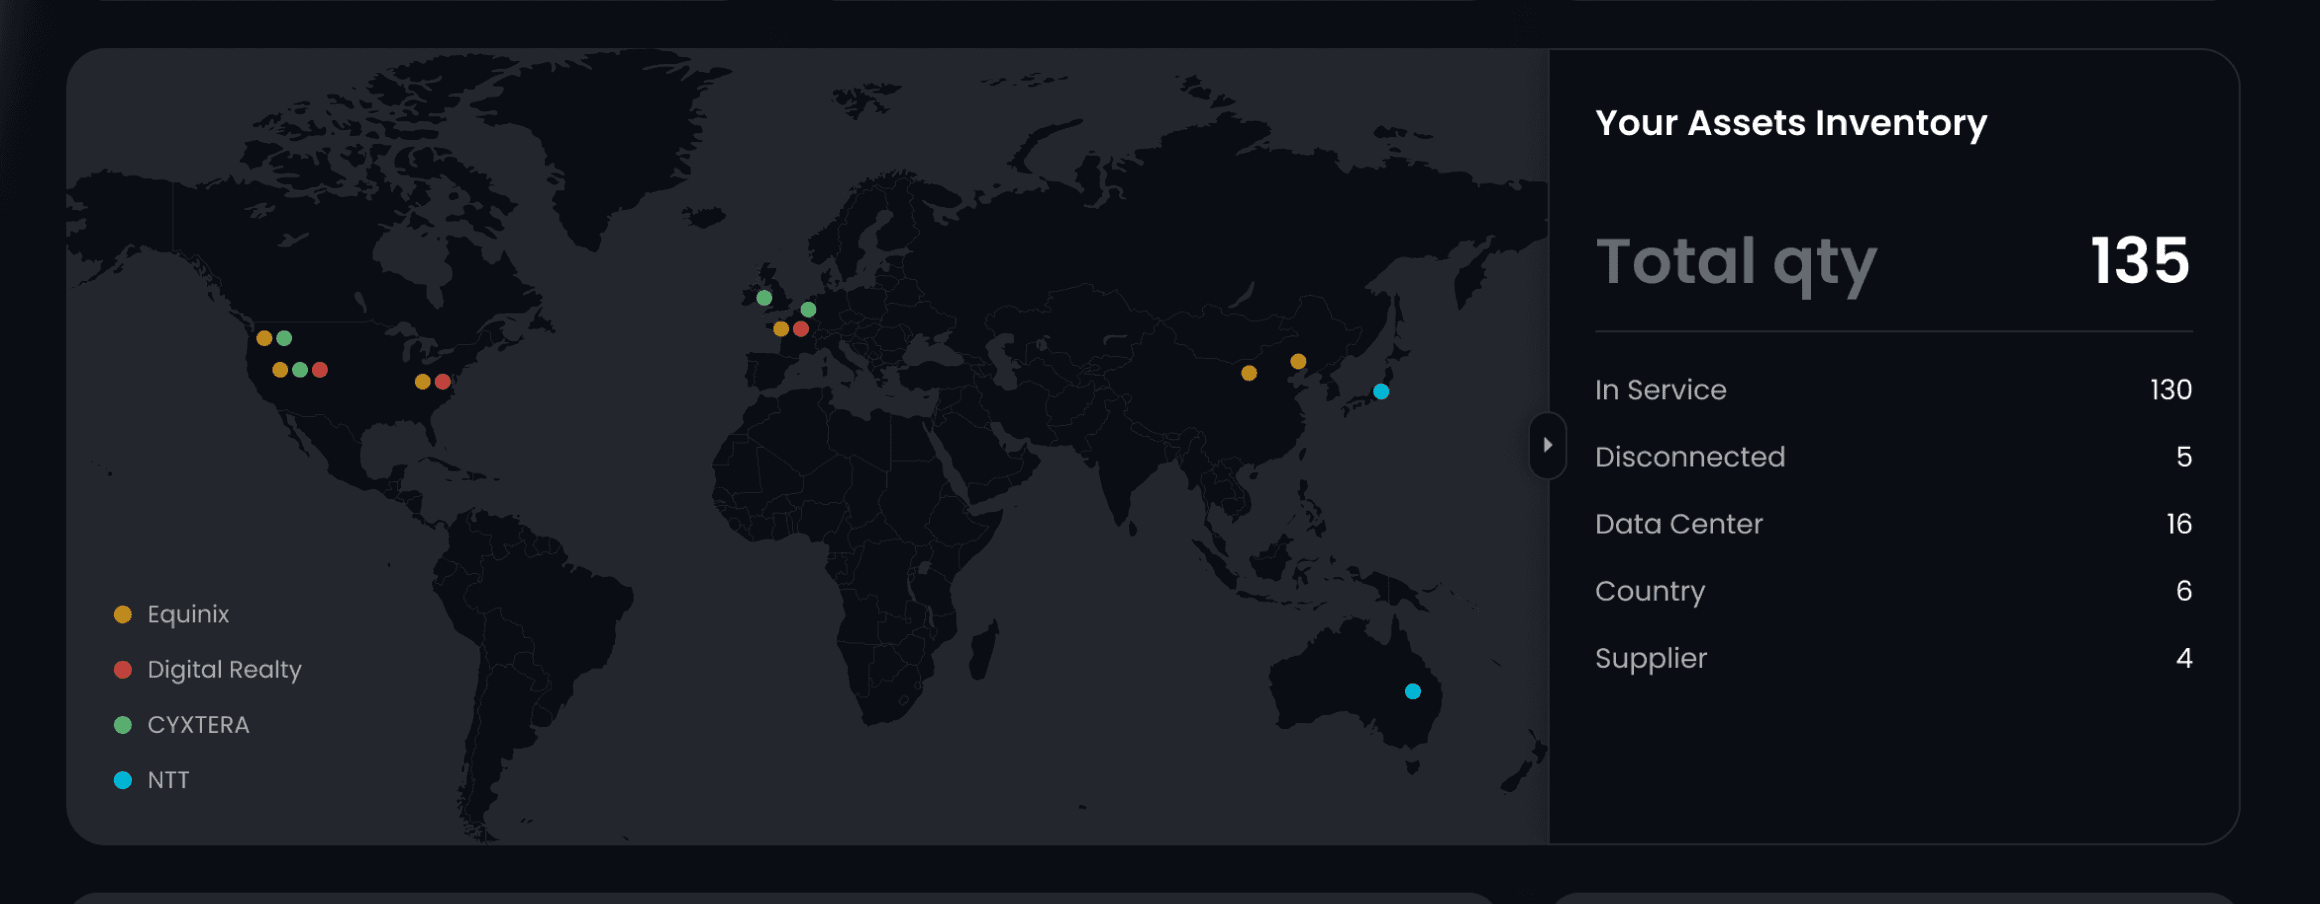
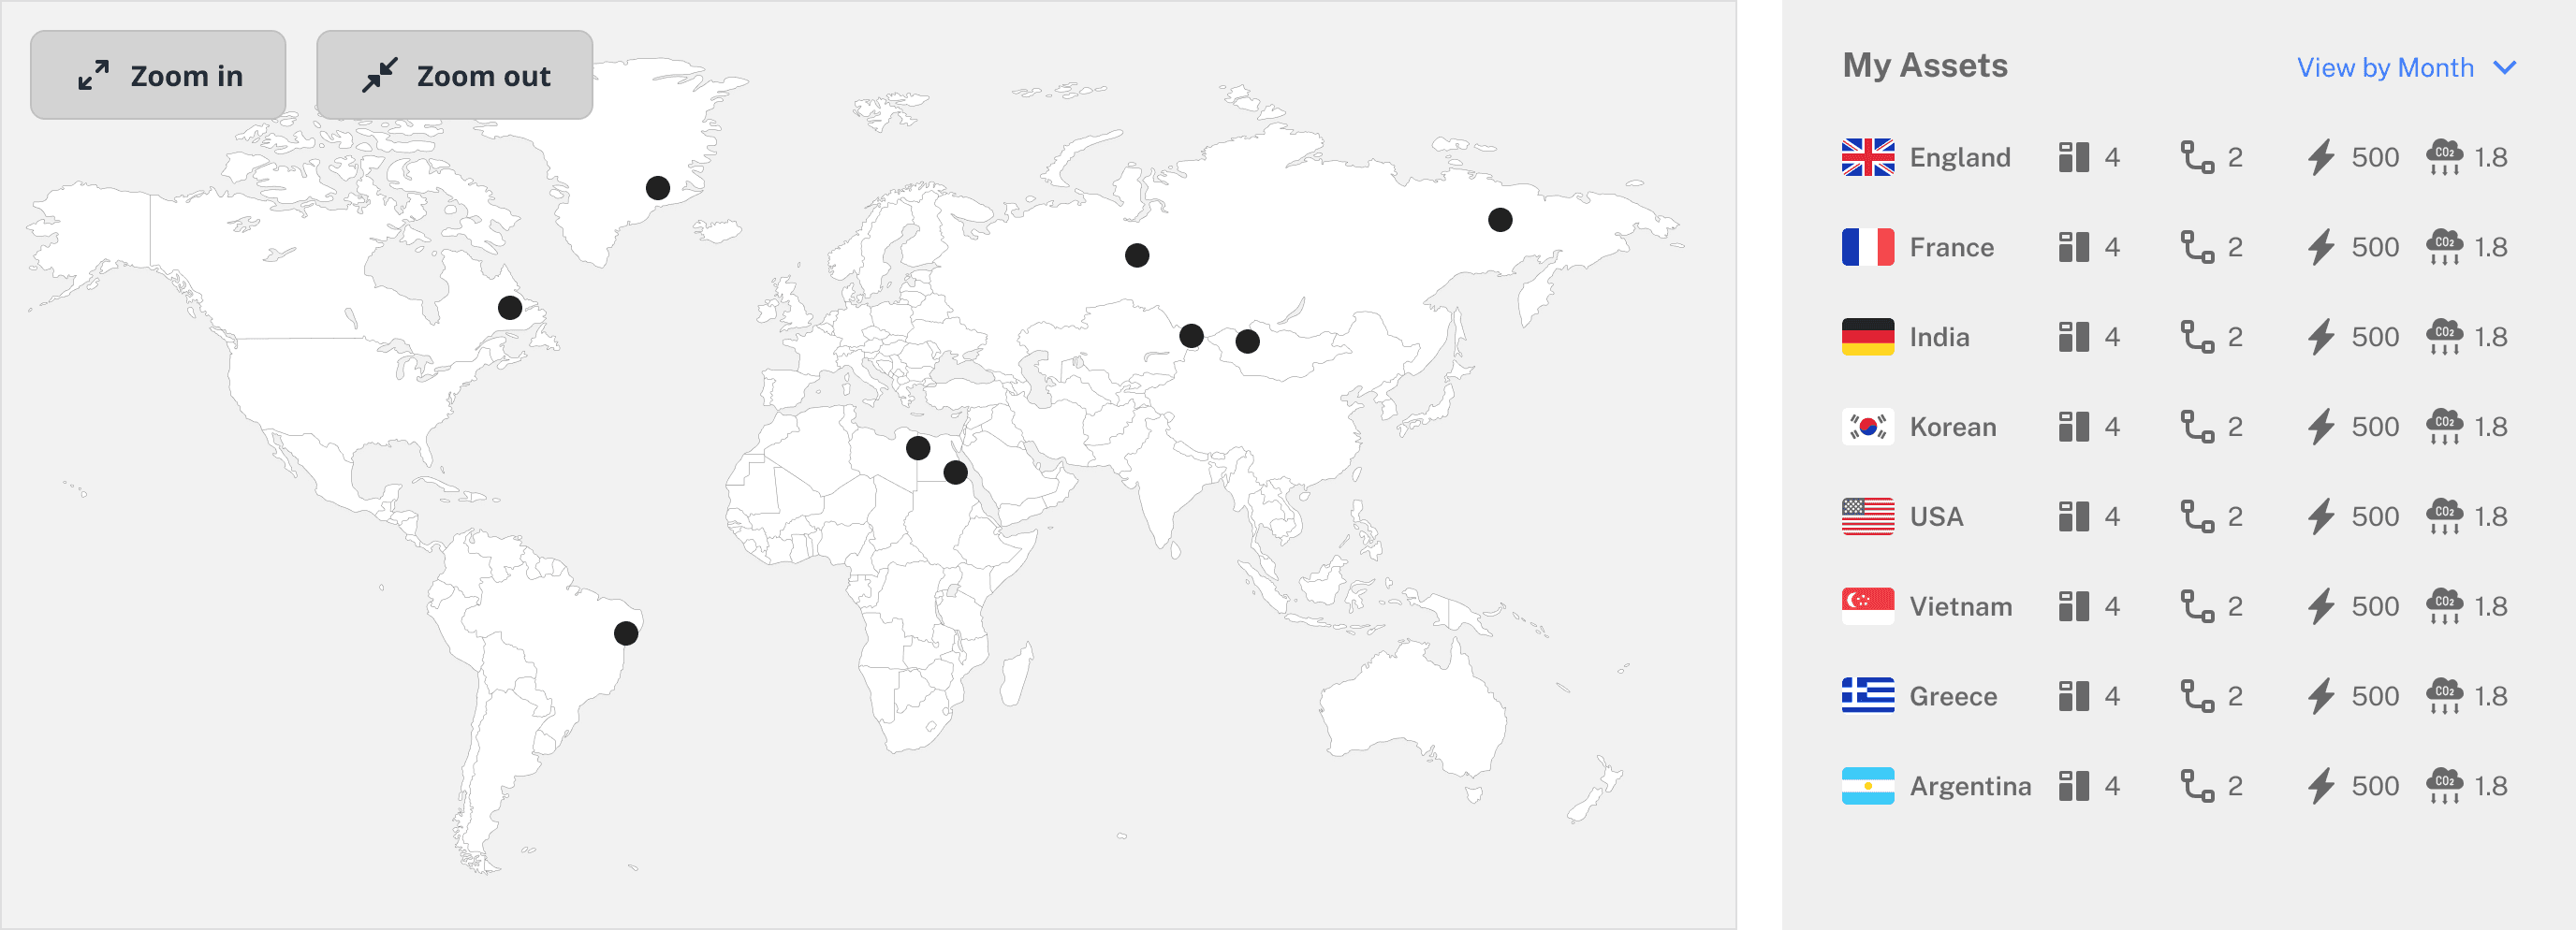
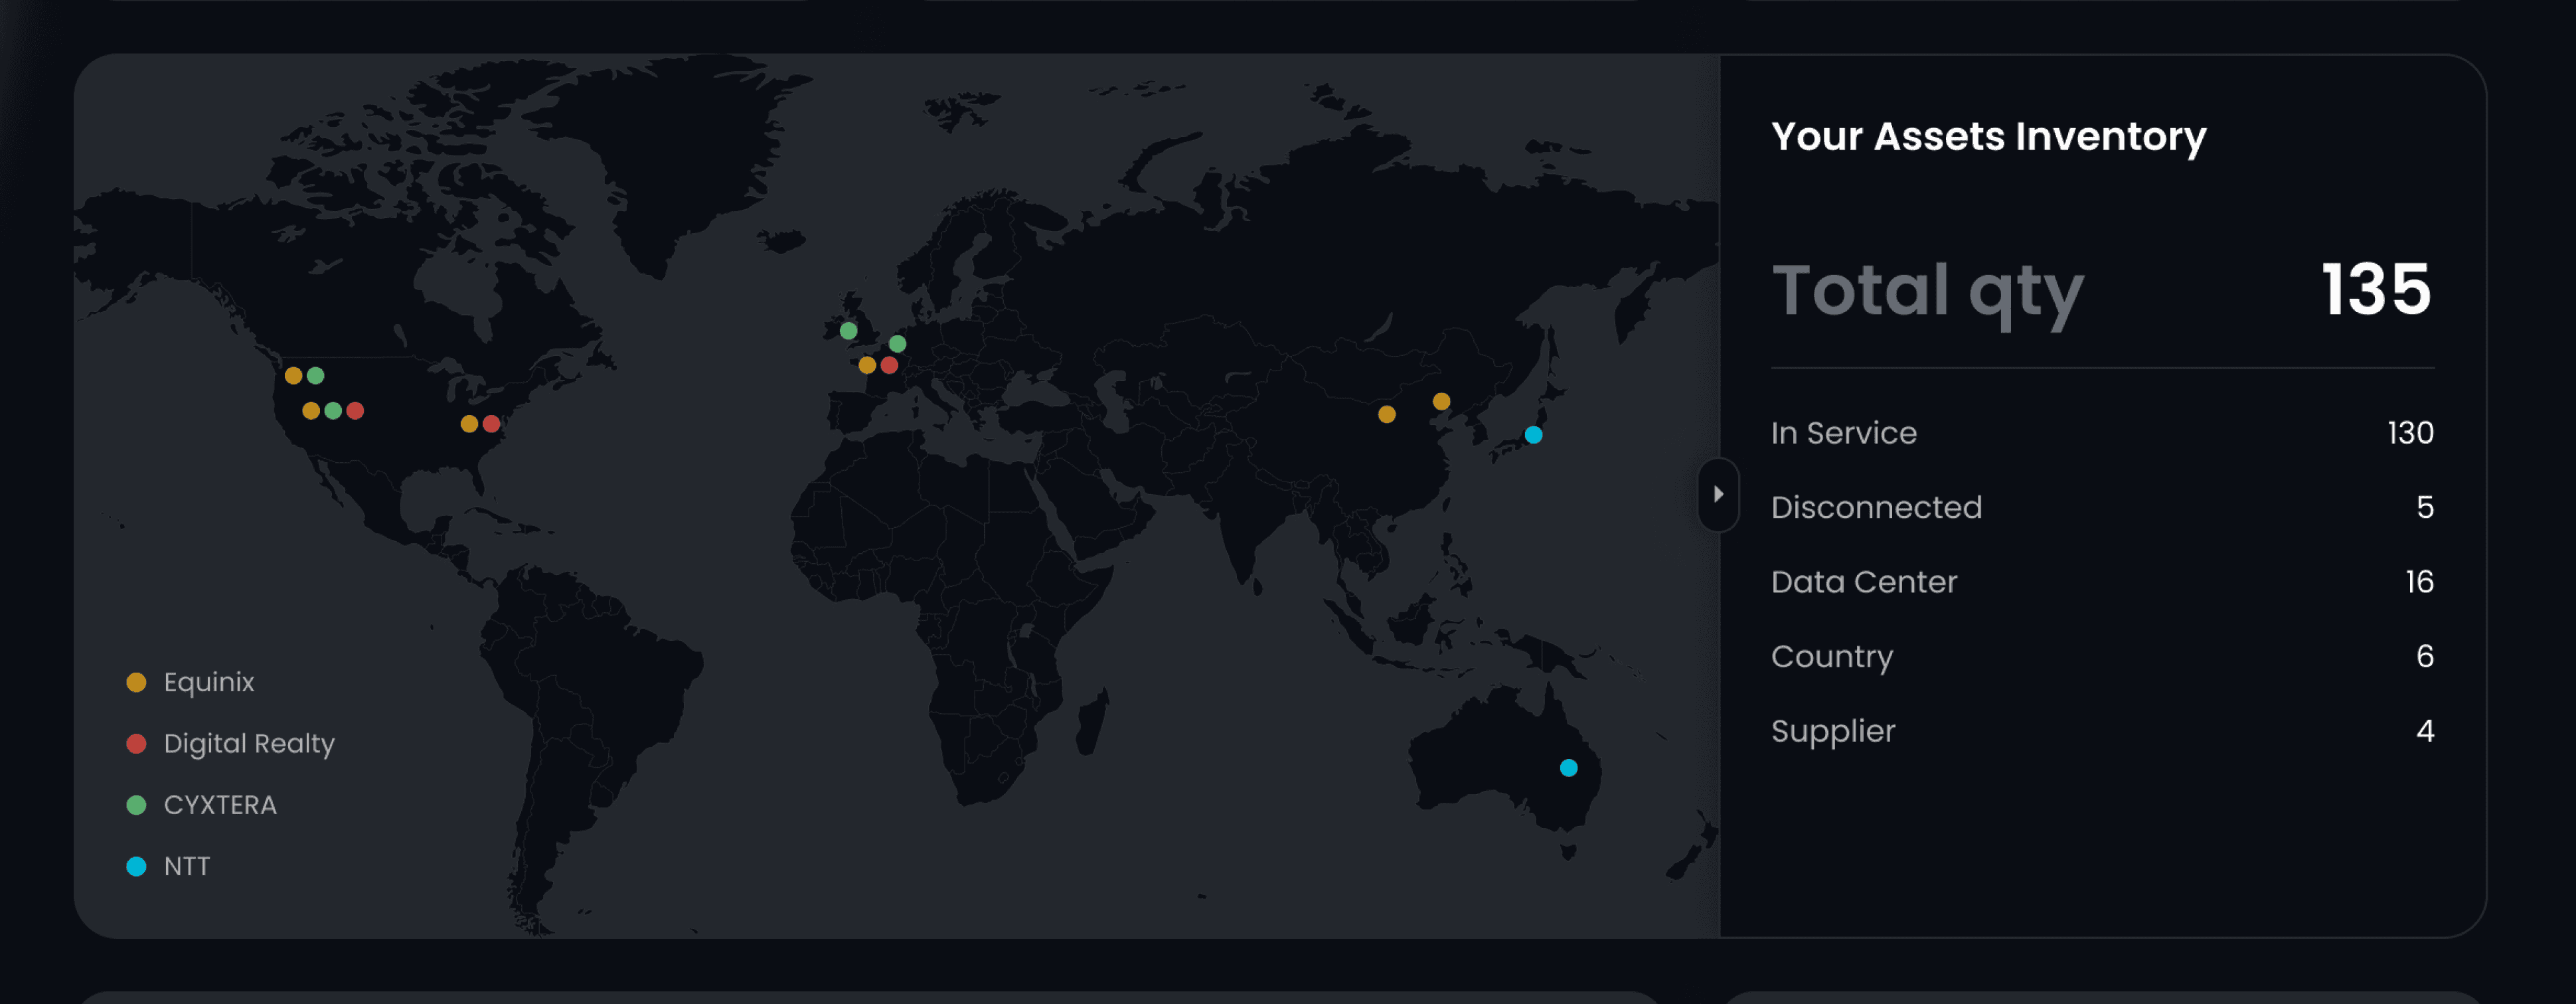
Monitor Inventory
Manager
Monitor Data
Grant Access
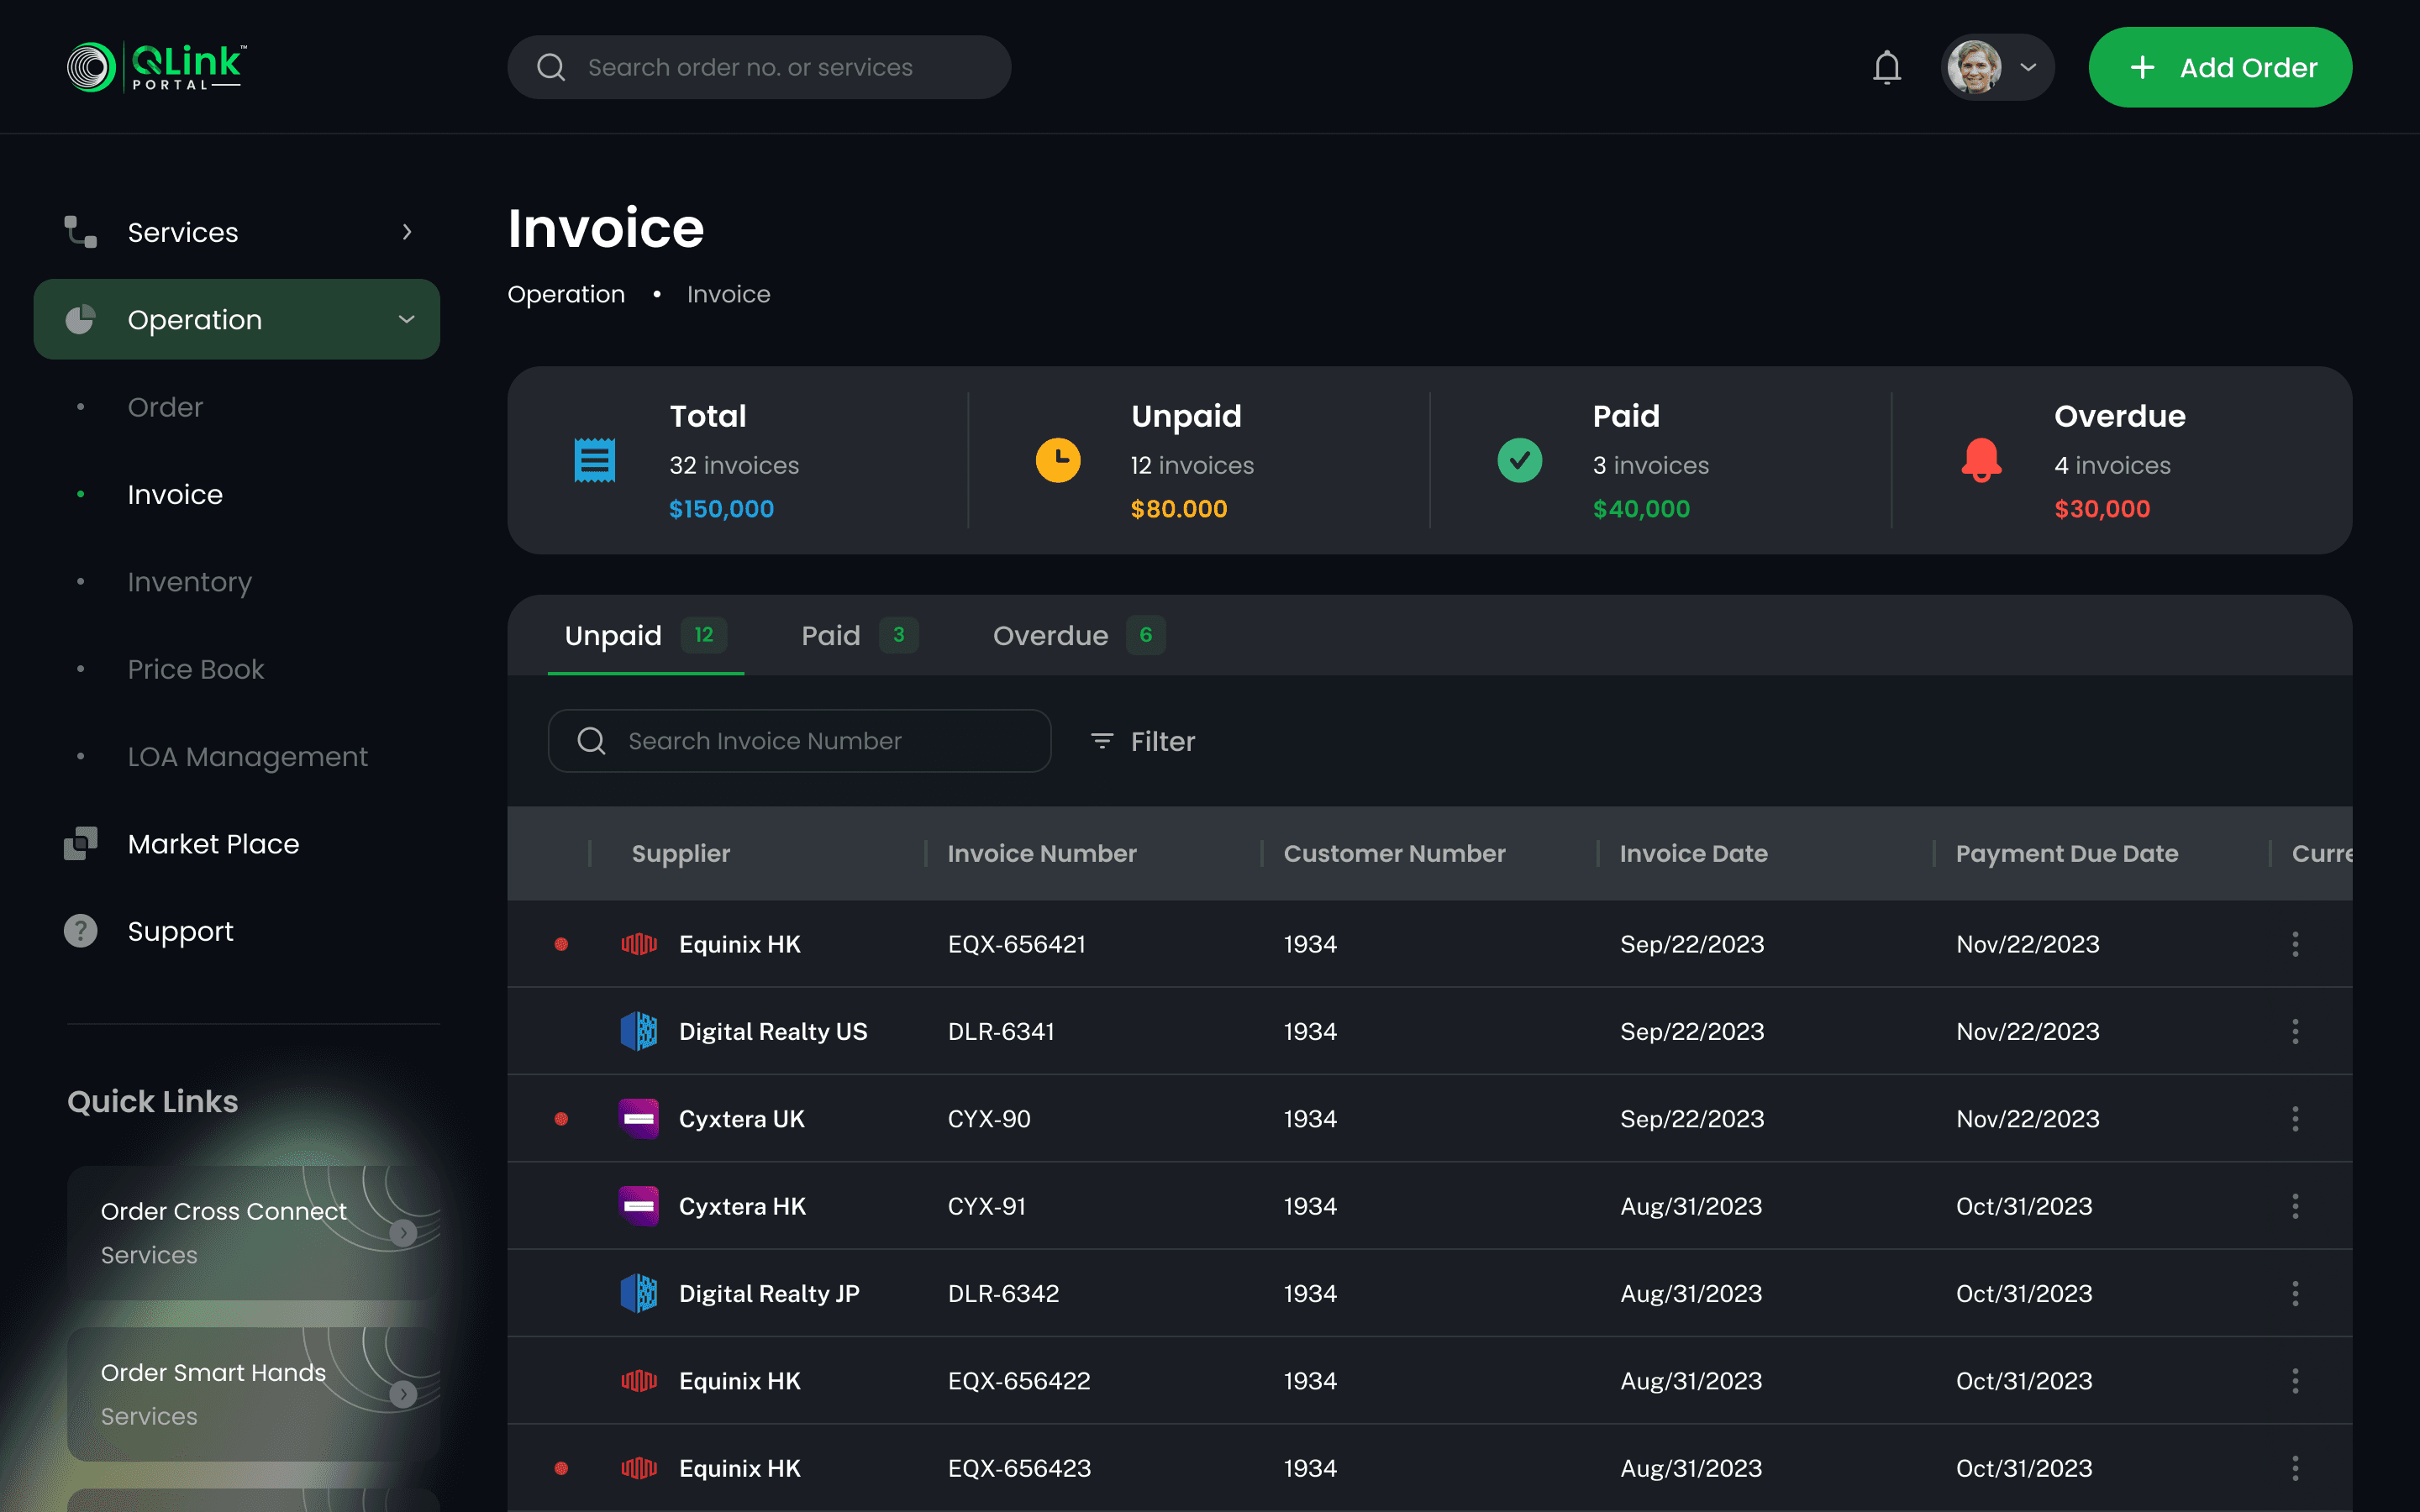
Approve Invoice
Competitor Studies
Studying the ordering process of competing products and the content displayed on the dashboard.
Internal Interview
Research
Consist with Brand Personality
Provide Cross Supplier Data
Enhance Work Efficiency and Usability


Thanks
For Watching
About
QLink
Access to multiple suppliers
Form standardized
Data integration
Supplier market place
Task-Oriented
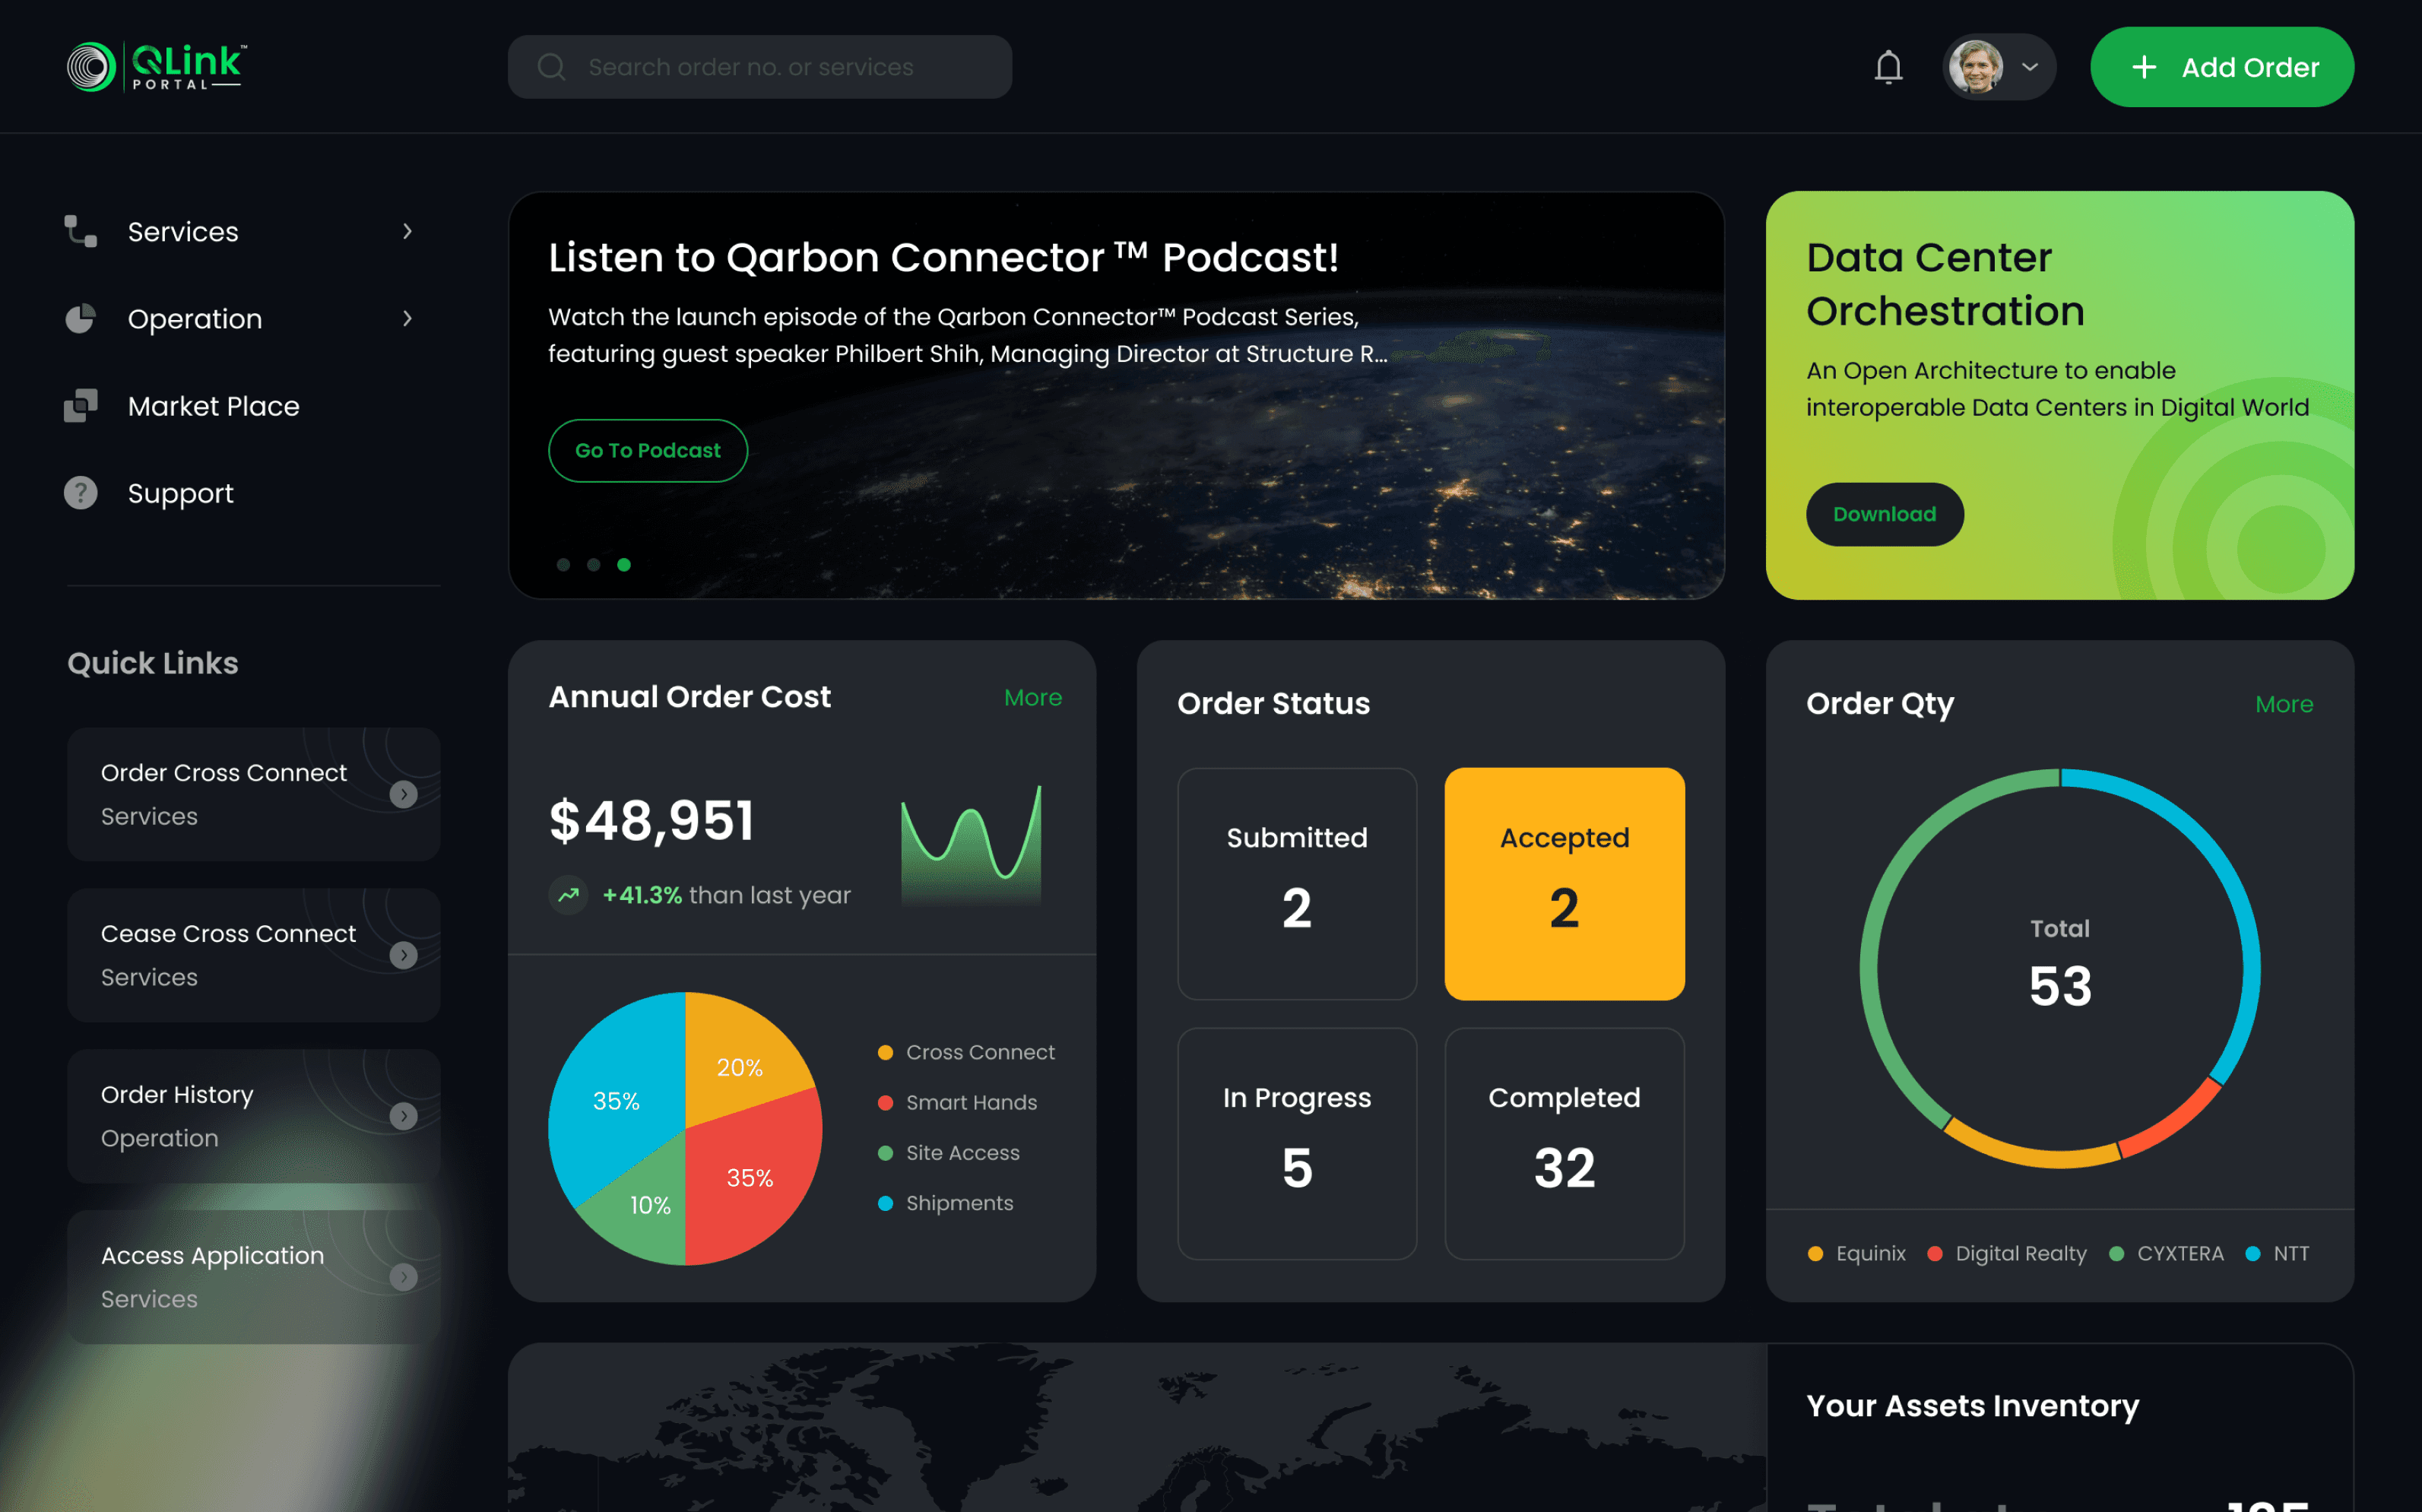
Quick access to order(Cross Connect, Smart Hand)
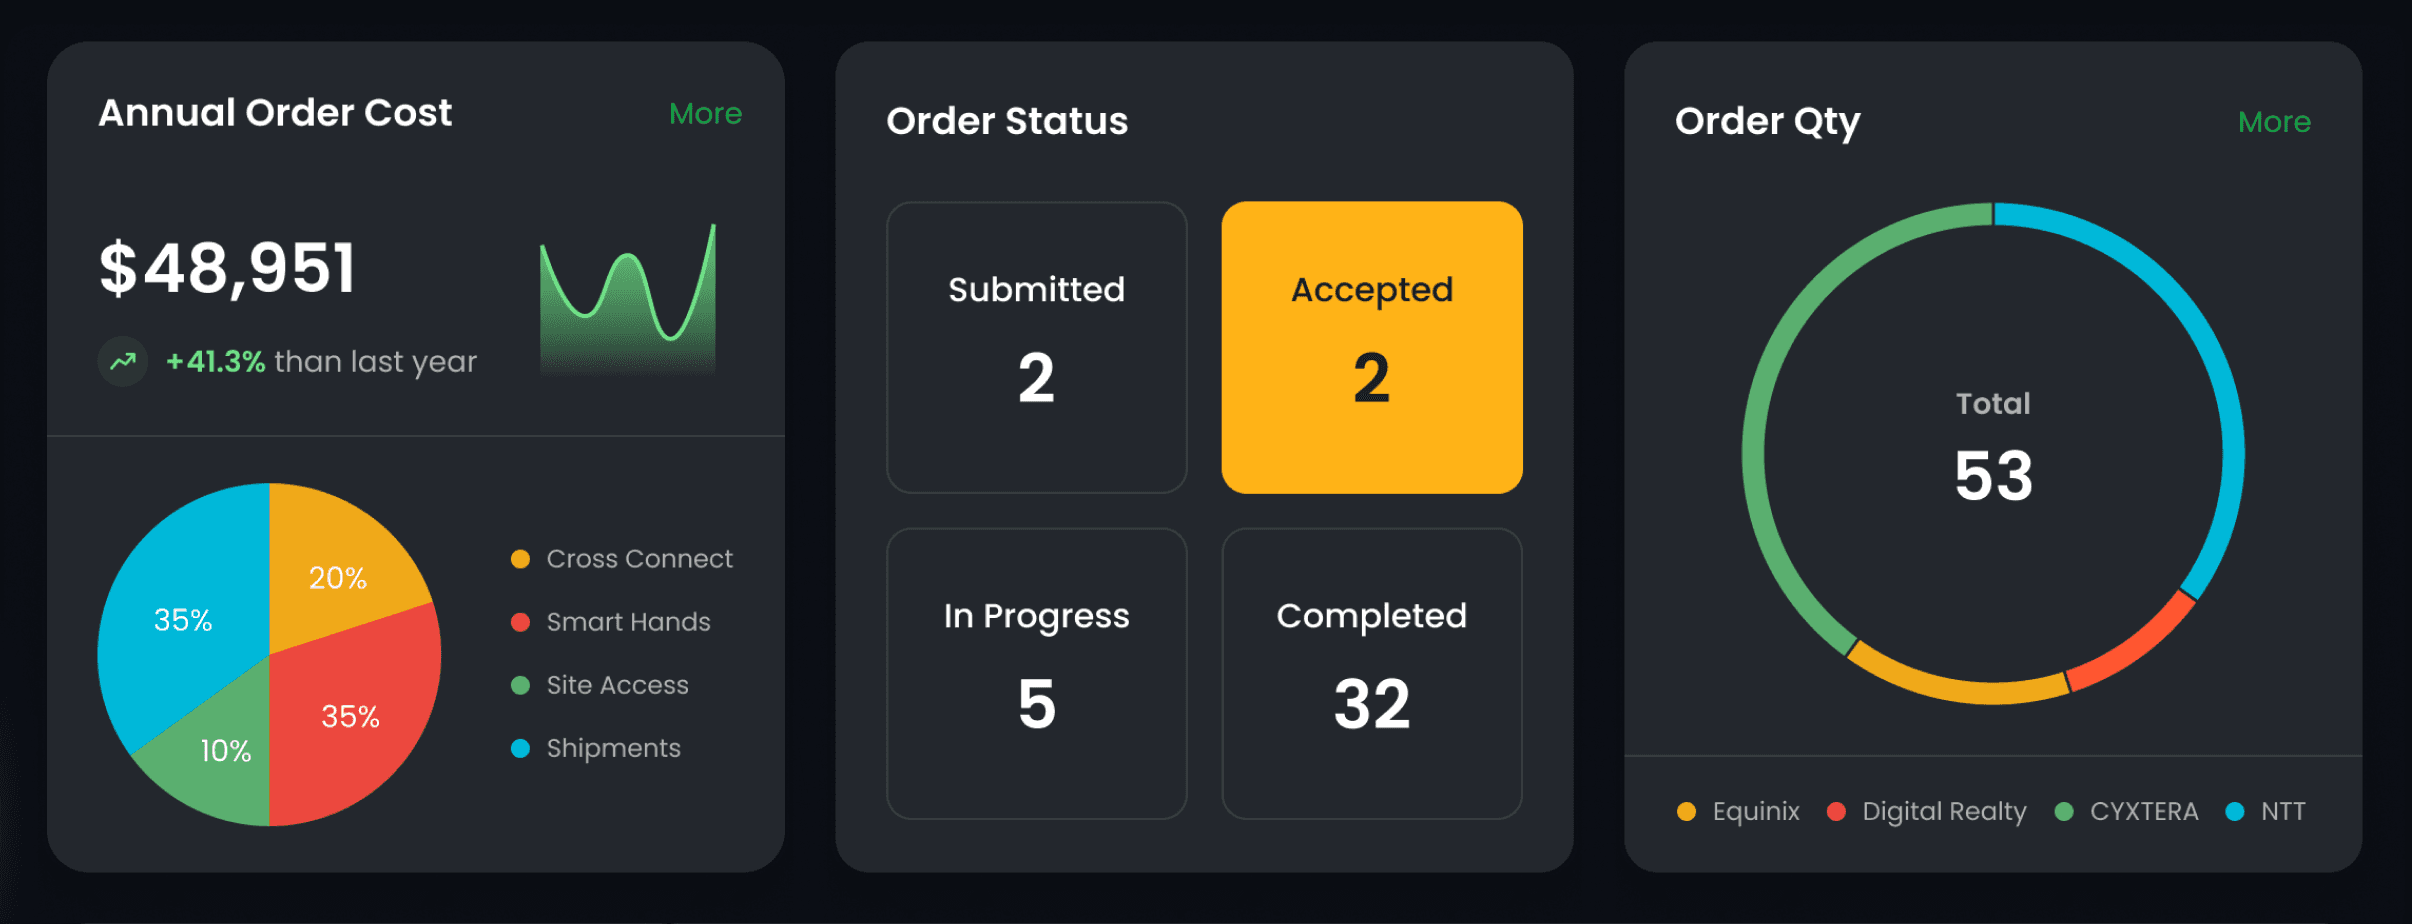
Monitoring order status
Inventory management
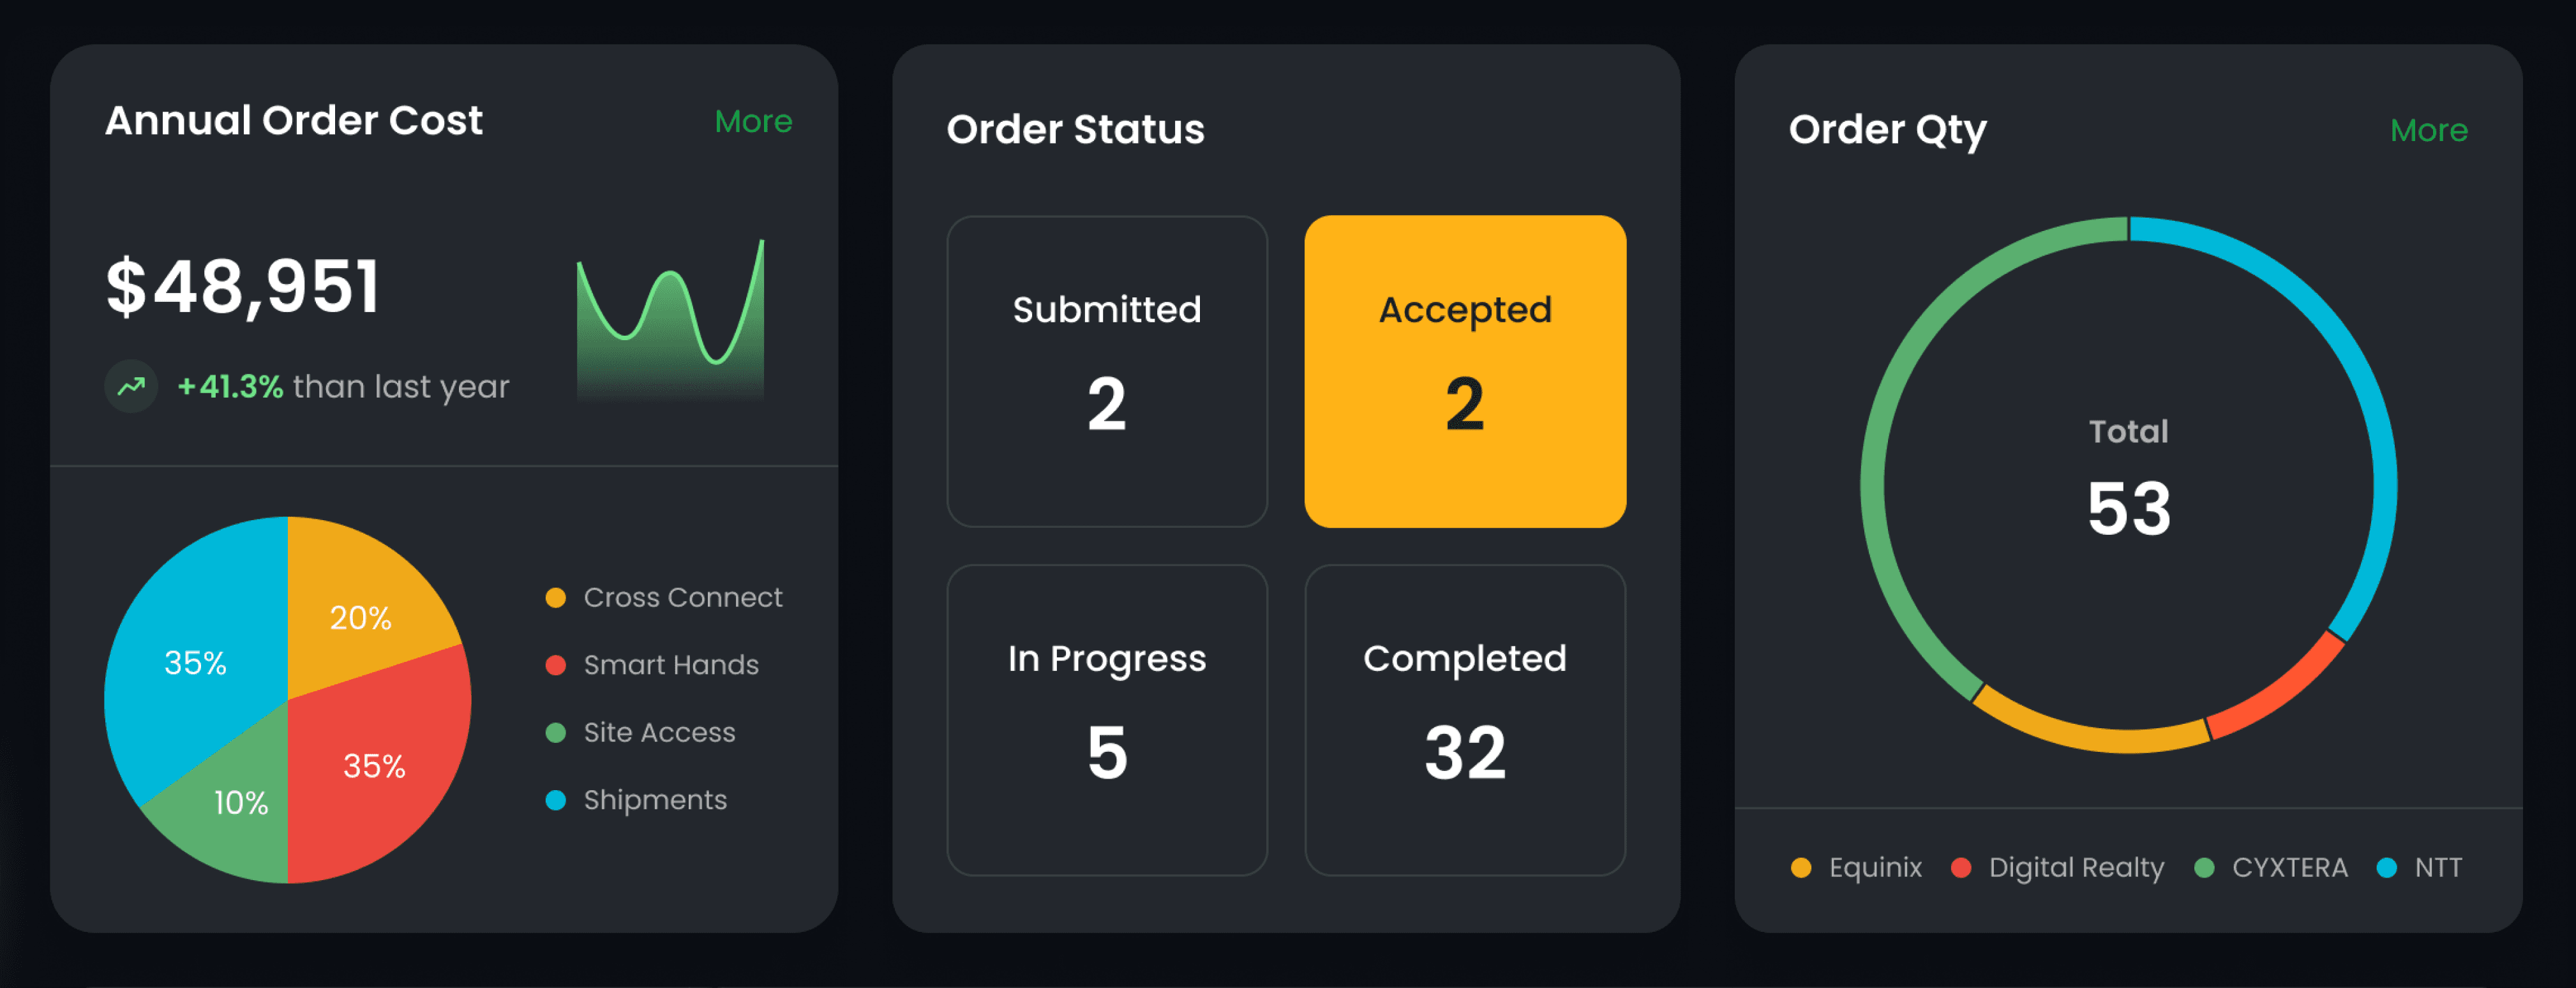
More data driven
Critical data (cost / alerts)
Invoice validation
Decision making assistance
Brand future value
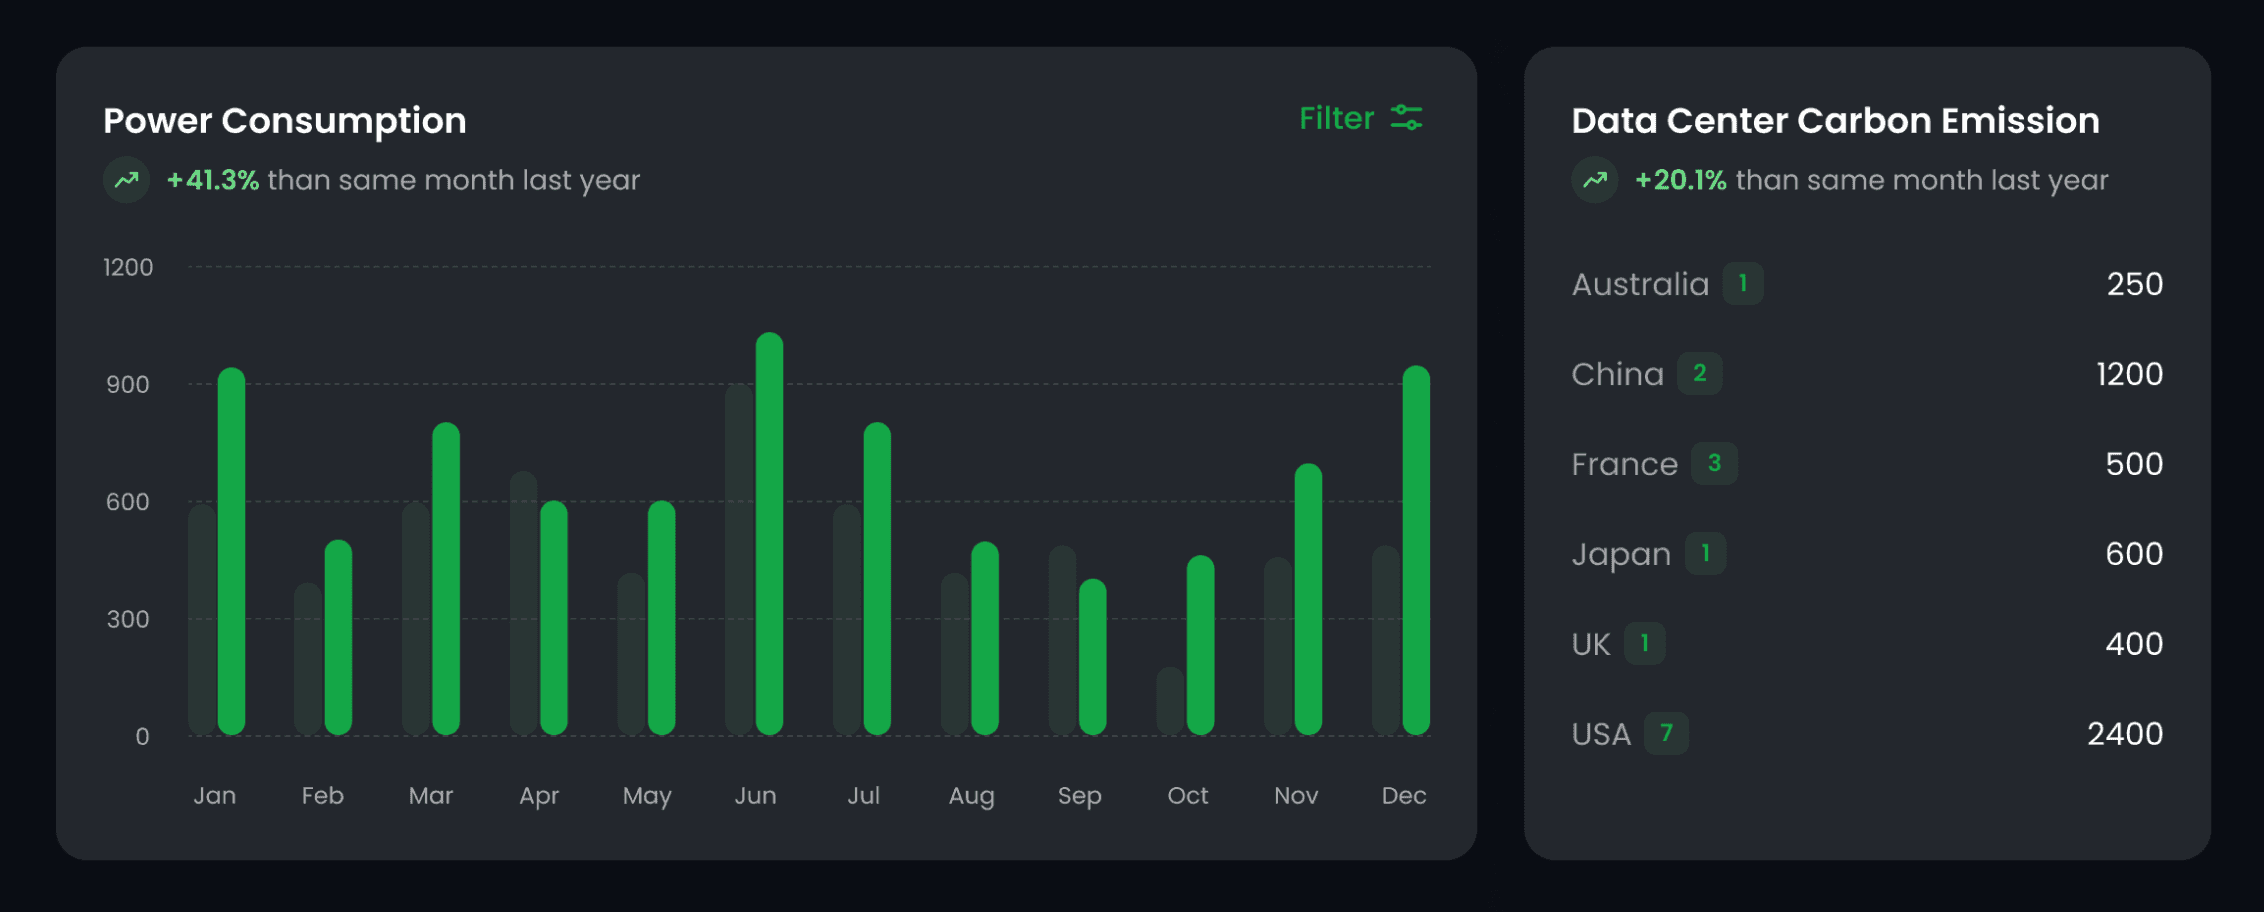
Energy saving trend
White paper sharing
Future services
Insights
Design Strategy
Target
User


Order History


Invoice